Product Design Case
ERP & CRM for Business, B2B/B2C, Product Design
Update Oct 2026: I later turned this ERP into a coded design system documented in Storybook.
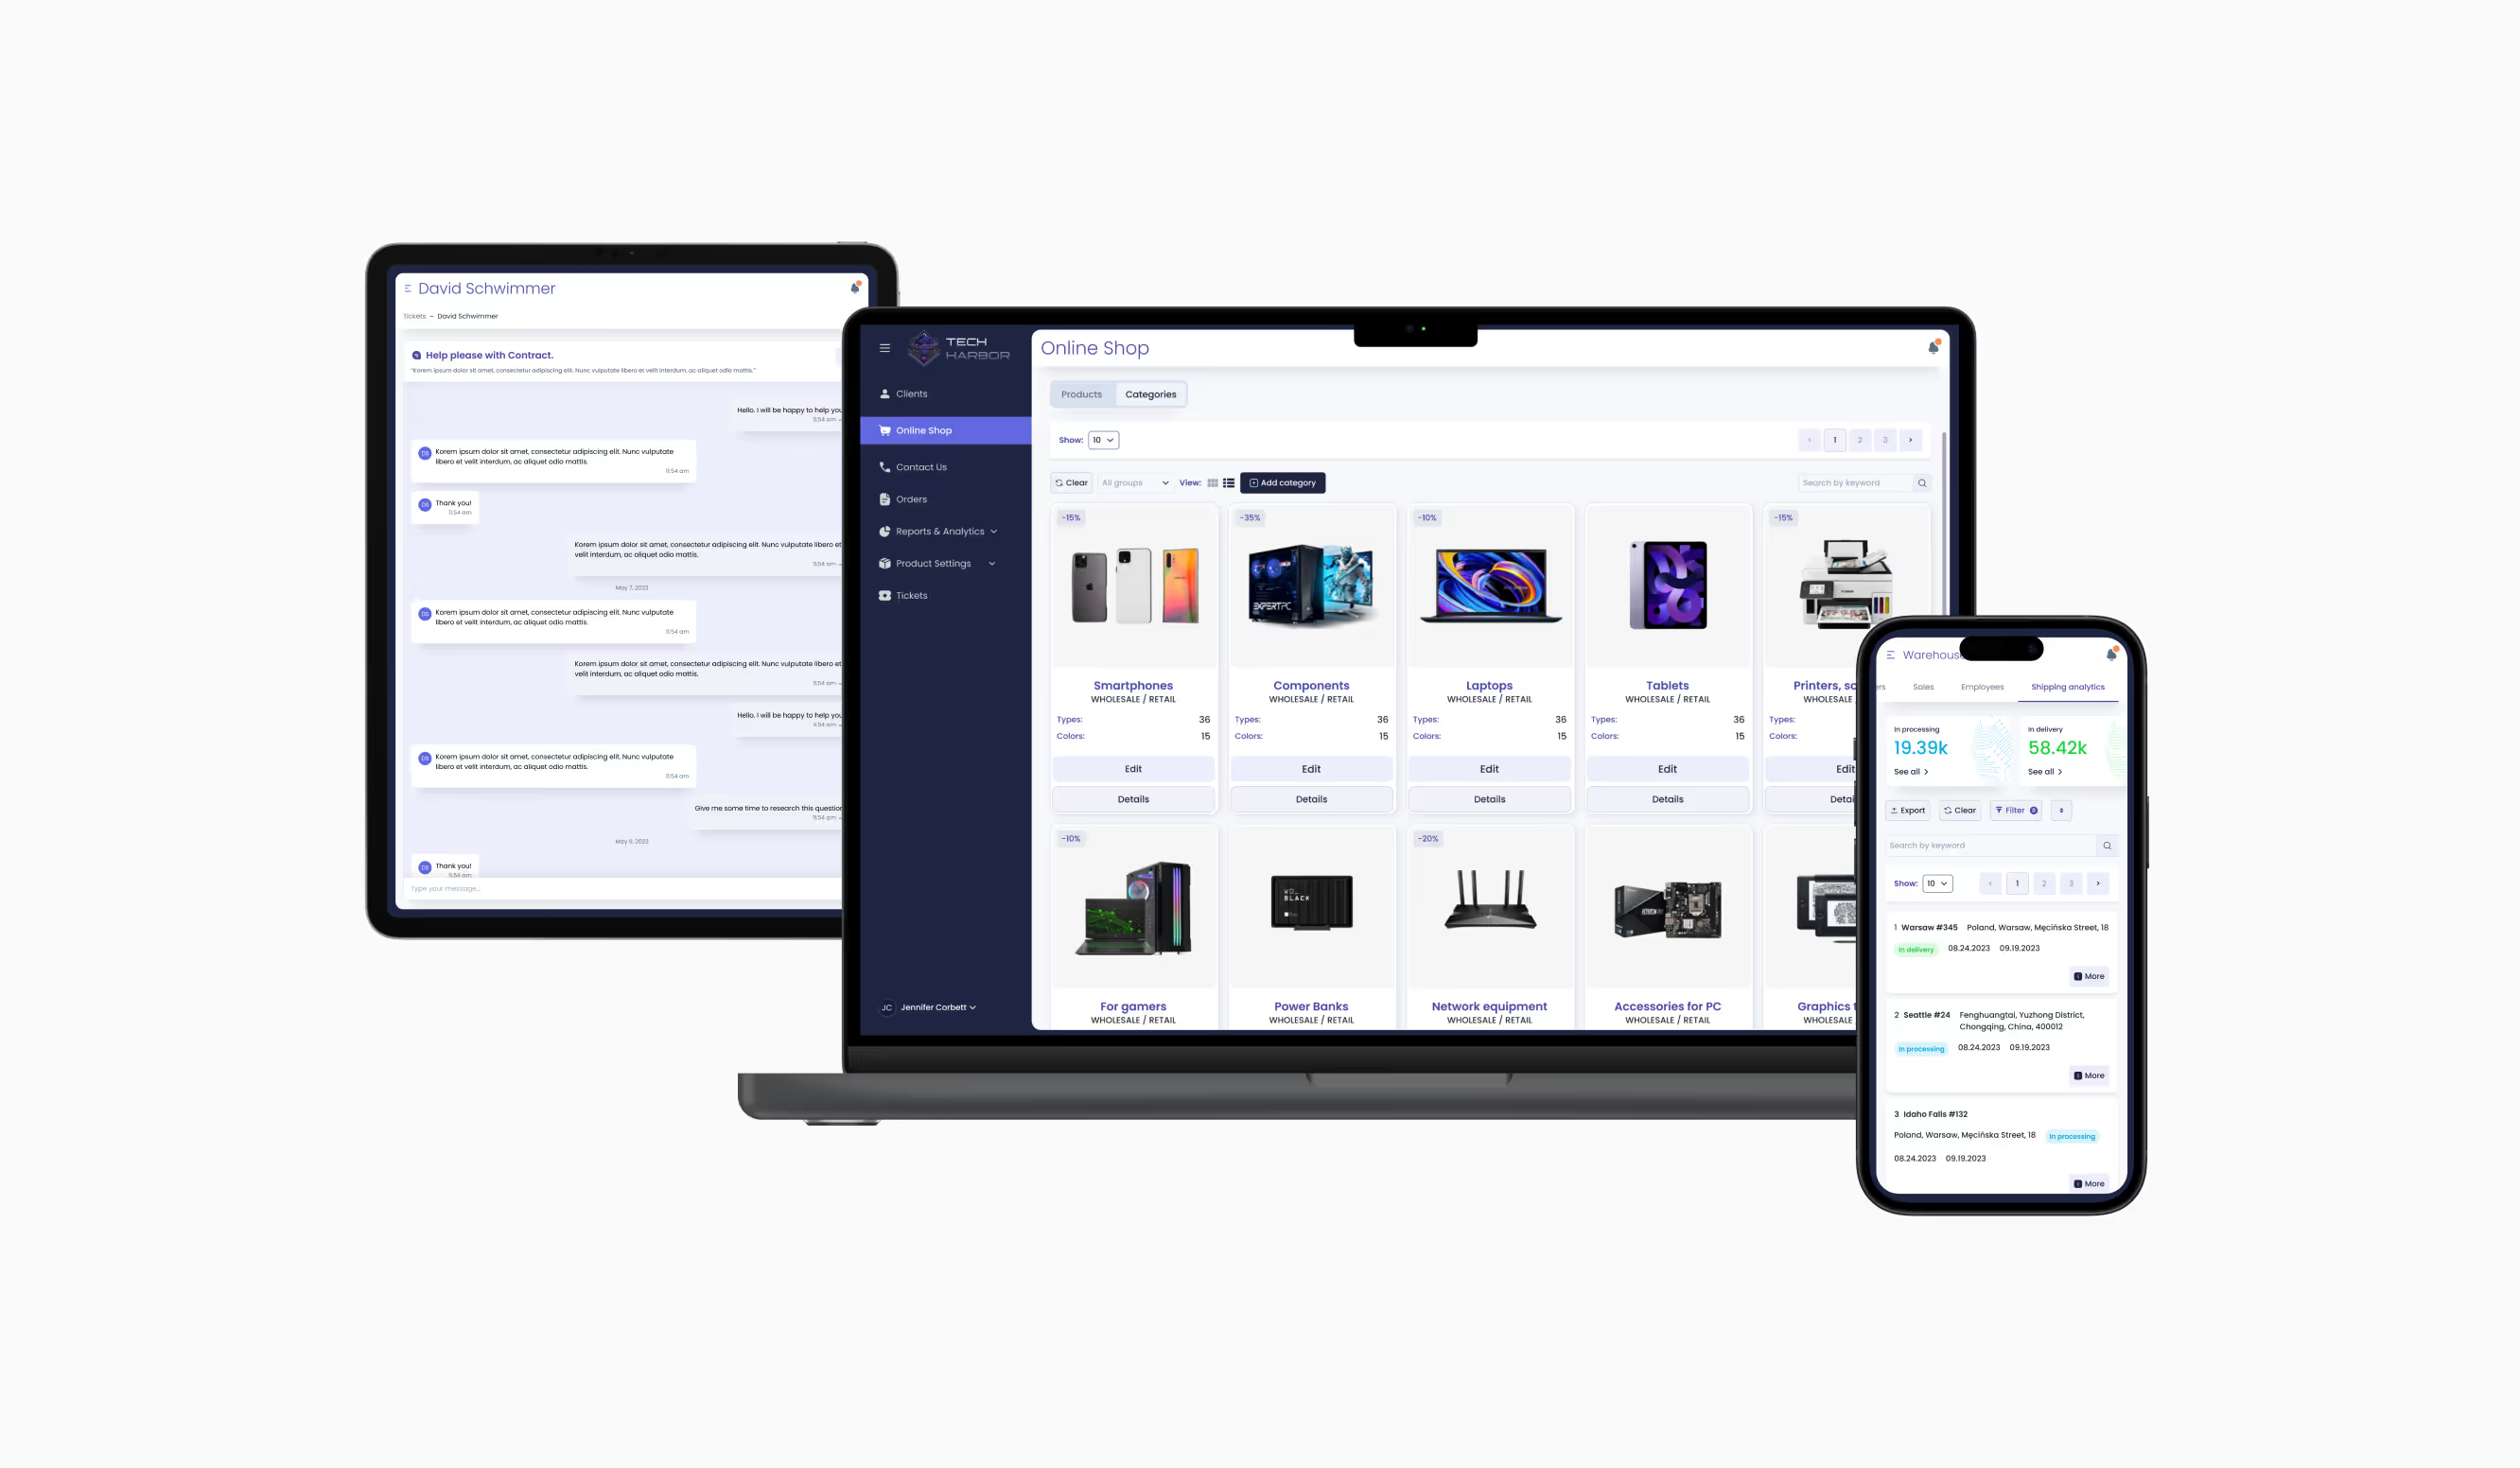
About ERP System
Introduction
Tech Harbor ERP System is designed for convenient management of large companies involved in product creation and collaboration with distributors. It proves beneficial for directors, managers, marketers, lawyers, and finance professionals within the organization. The system covers five departments of the company (Management, Warehouses, Finances, Lawyers, Marketers) plus a separate interface for Distributors, six modules in total. It remains intuitive both for tech-savvy users and for those less familiar with new technologies. This case study explores how users handle their daily tasks based on their roles.
My Role
Interface and Product Designer.
The methodology involved empathizing with the problem, defining it, brainstorming solutions, designing, prototyping, and testing.
My Responsibilities
Conducting interviews, paper and digital wireframing, low- and high-fidelity prototyping, conducting usability studies, accounting for accessibility, and iterating on designs.
Tools Used





Design engineering: Storybook · React · TypeScript · Figma Variables · Figma MCP · Claude Code · GitHub · Vercel
Research and Hypothesis
Problem Statement
The Tech Harbor ERP system is designed to streamline company management, yet users, primarily working professionals aged 22 to 65, struggle with initial navigation despite finding the interface intuitive. These users value efficiency and intellectual development, leaving little time for complex or inconvenient workflows. How might we enhance the onboarding experience and navigation to ensure a seamless, time-efficient transition for users adopting the system?
Breakdown of the Problem
Struggles with scalability
The initial ERP system lacked the flexibility to handle growing business operations, making it inefficient for enterprises managing large volumes of data.
Complex workflows with a steep learning curve
The interface was functional but required users to spend time adapting, slowing down operations and reducing efficiency.
Fragmented user experience
Information was scattered across different sections, making it difficult for users to navigate and extract meaningful insights.
Outdated interface with usability gaps
The design followed traditional ERP structures, leading to usability challenges that hindered smooth and intuitive interactions.
Review of Decisions Made
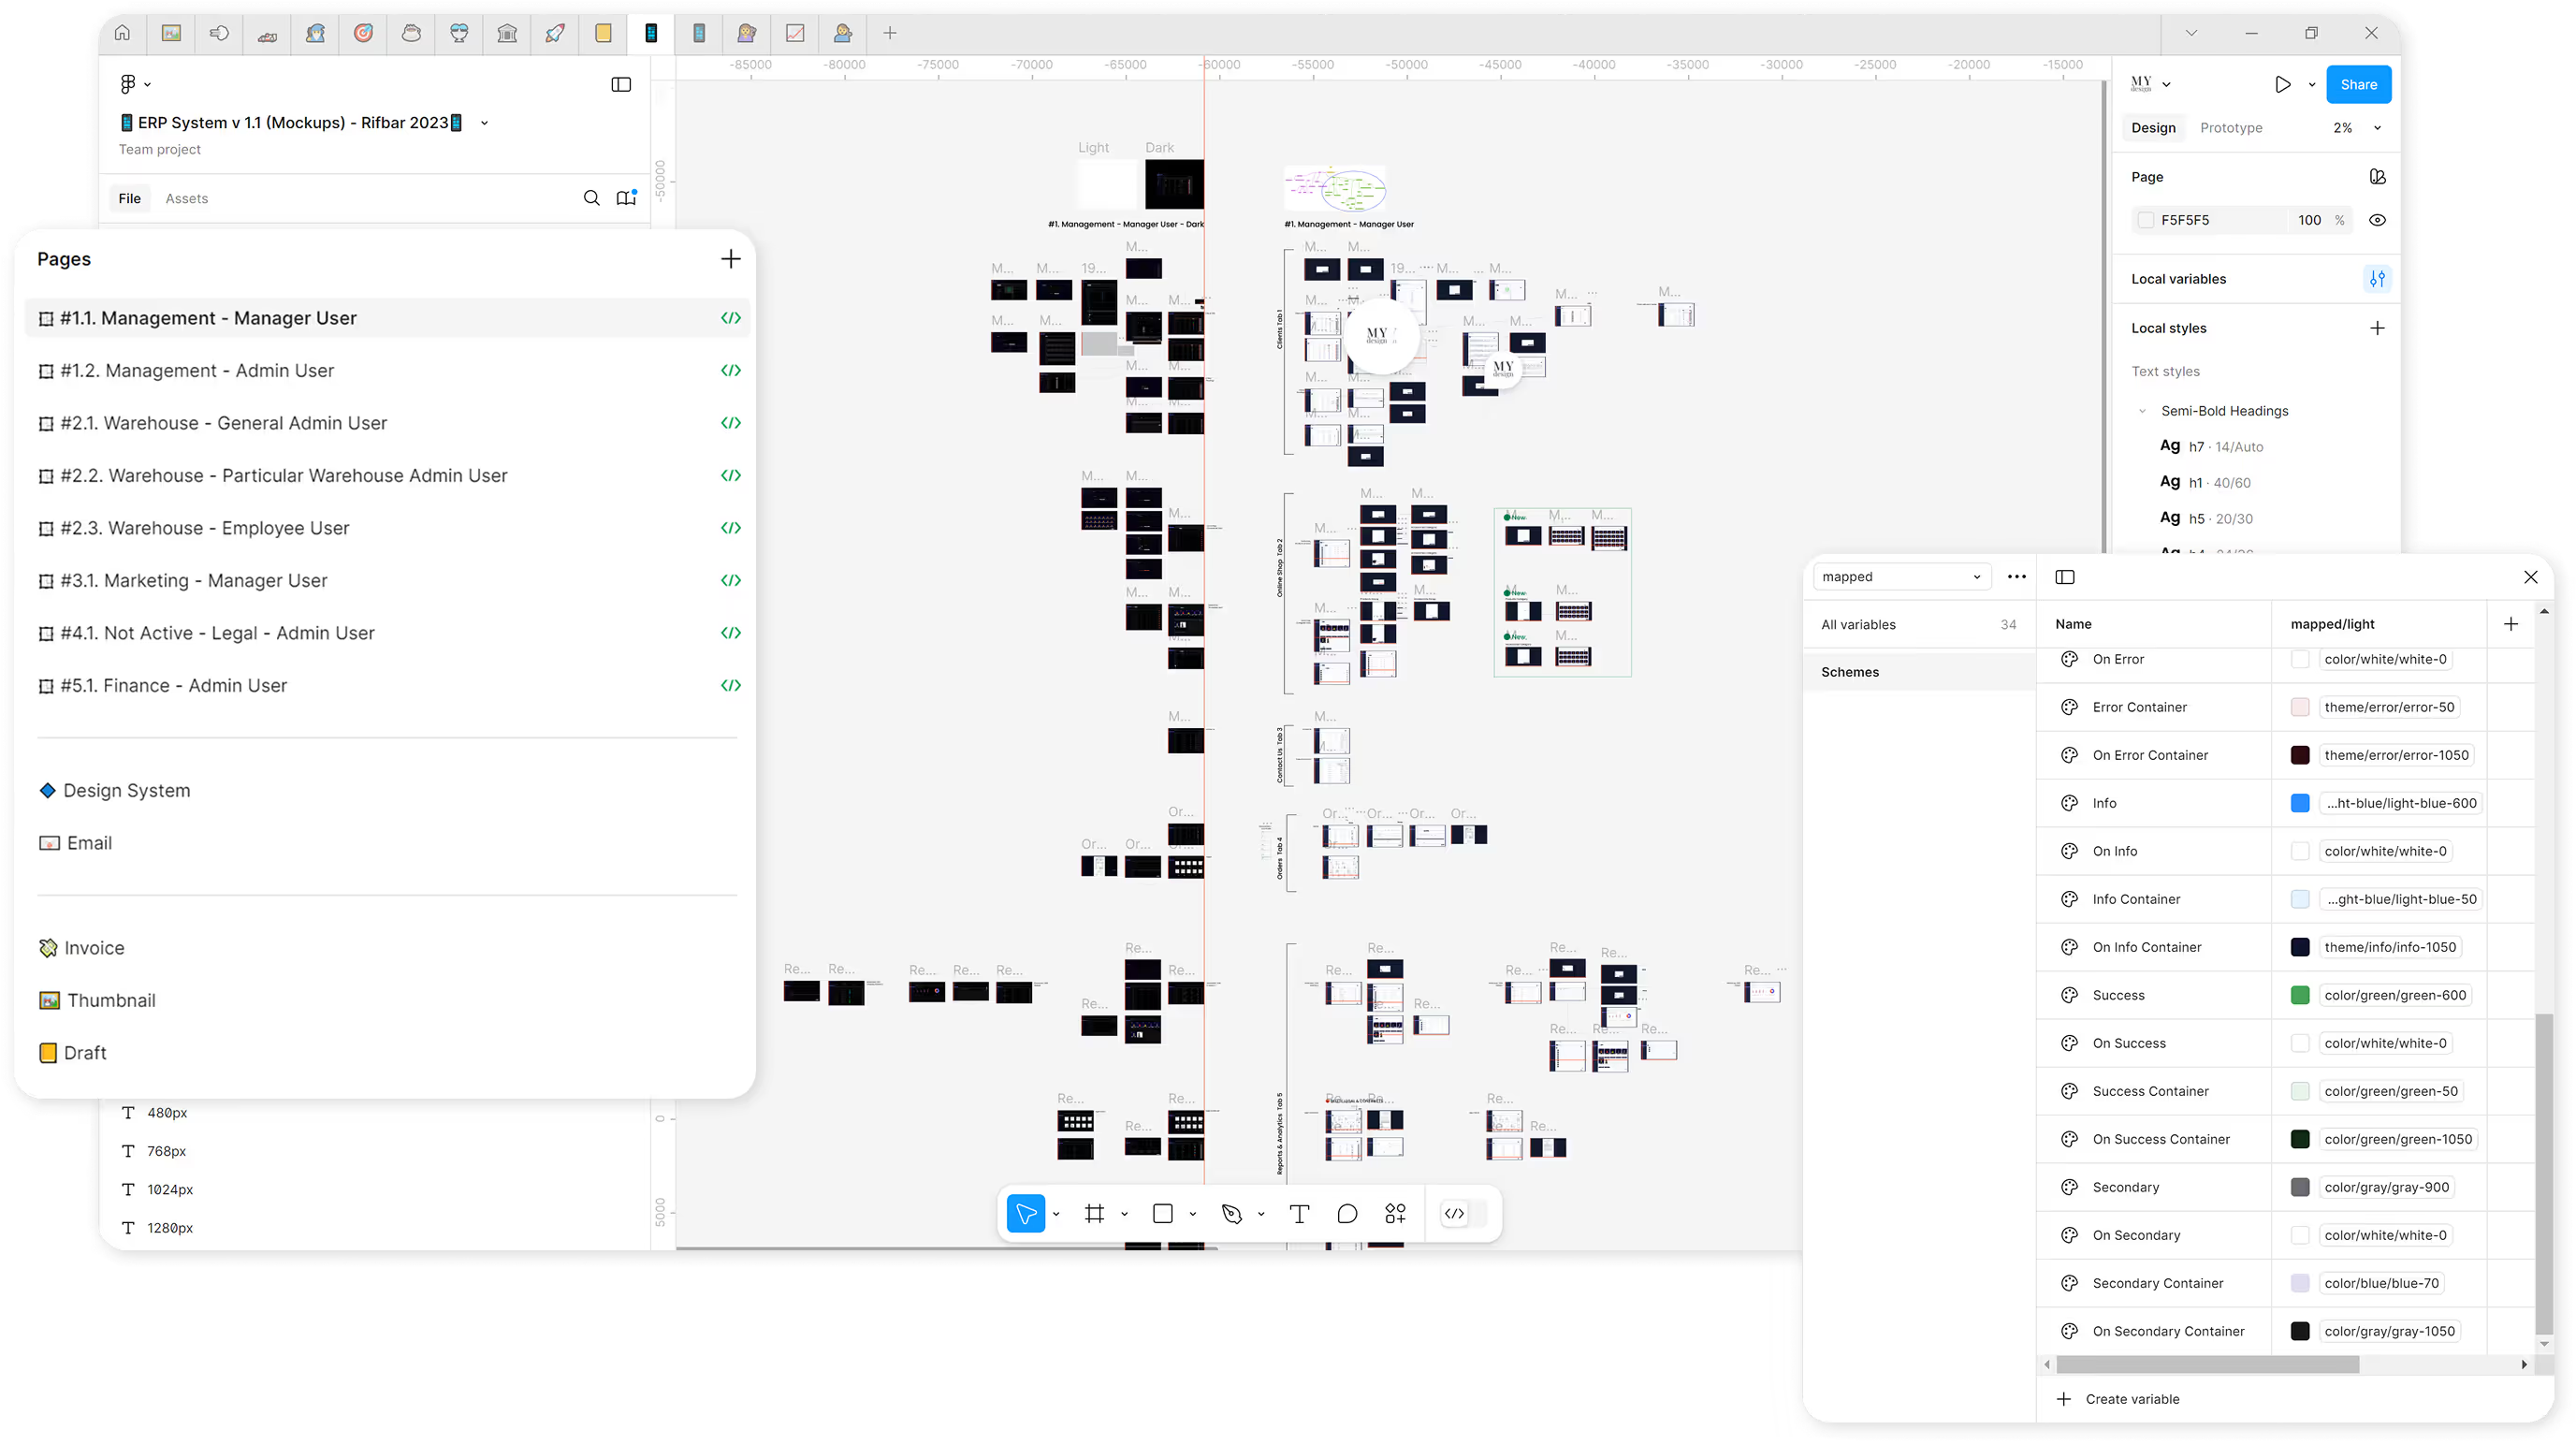
After conducting research and identifying key issues, the design was gradually developed for various departments of the ERP system.
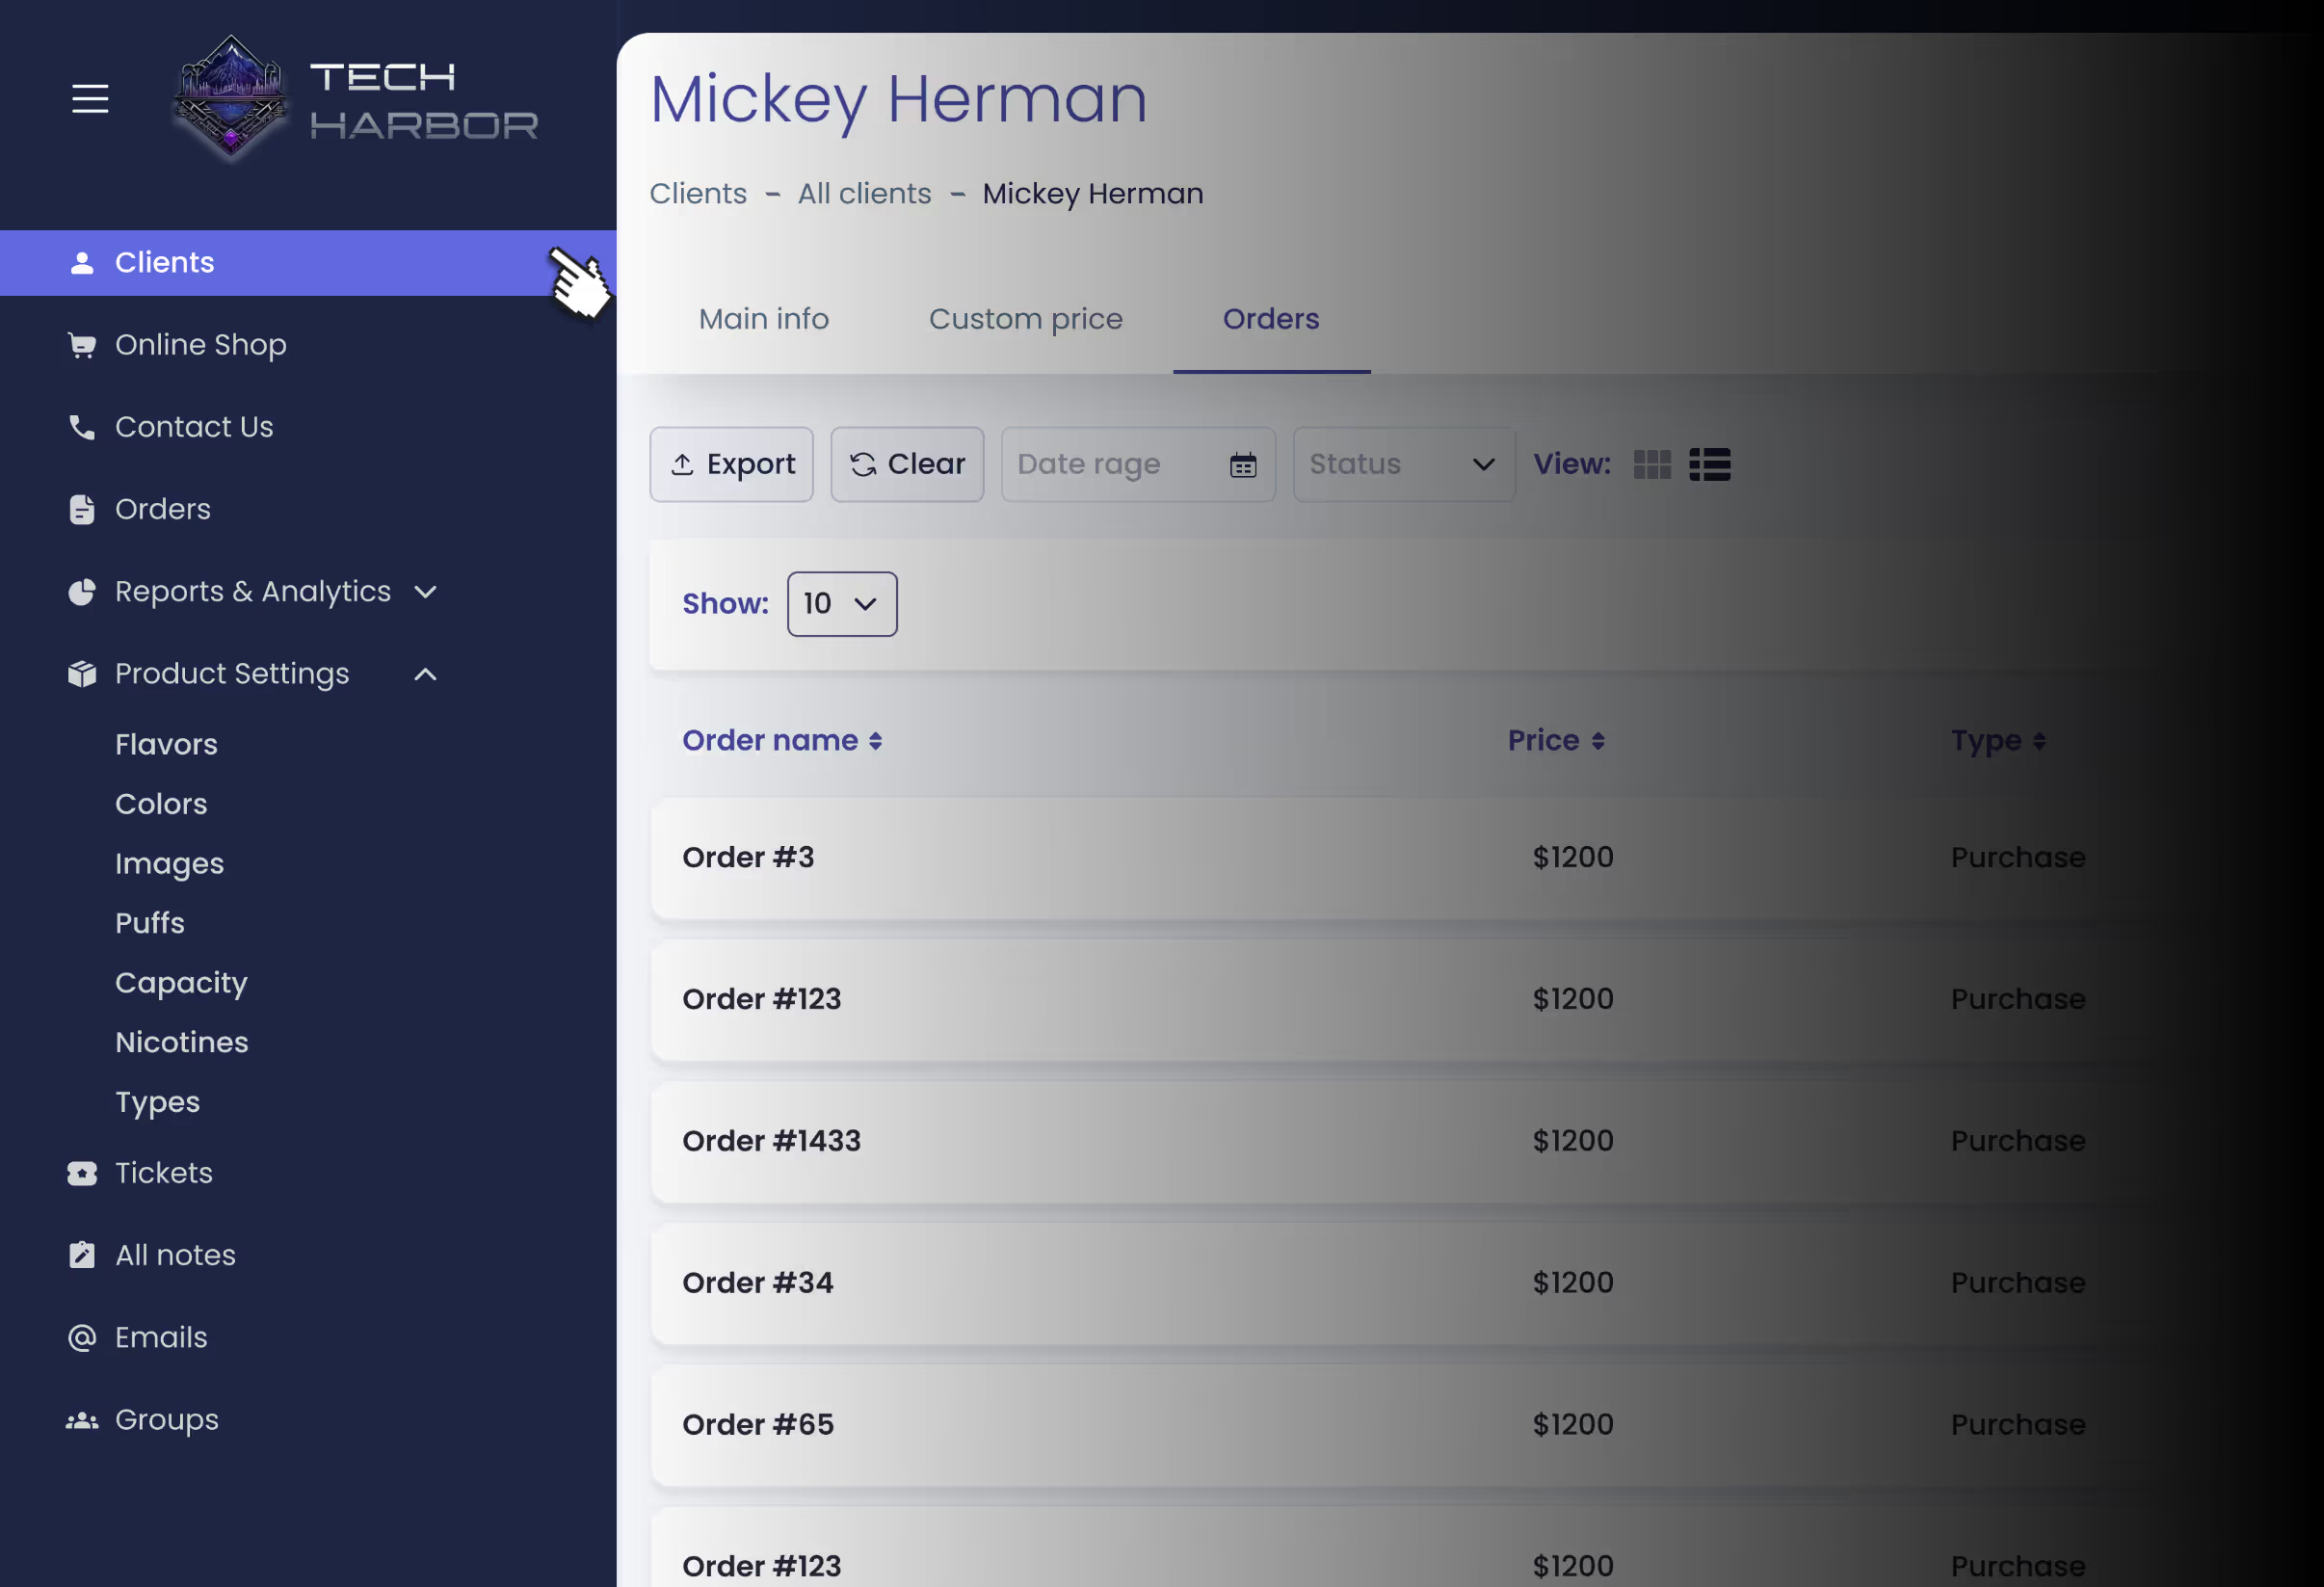
Navigation menu for the "Manager" user.
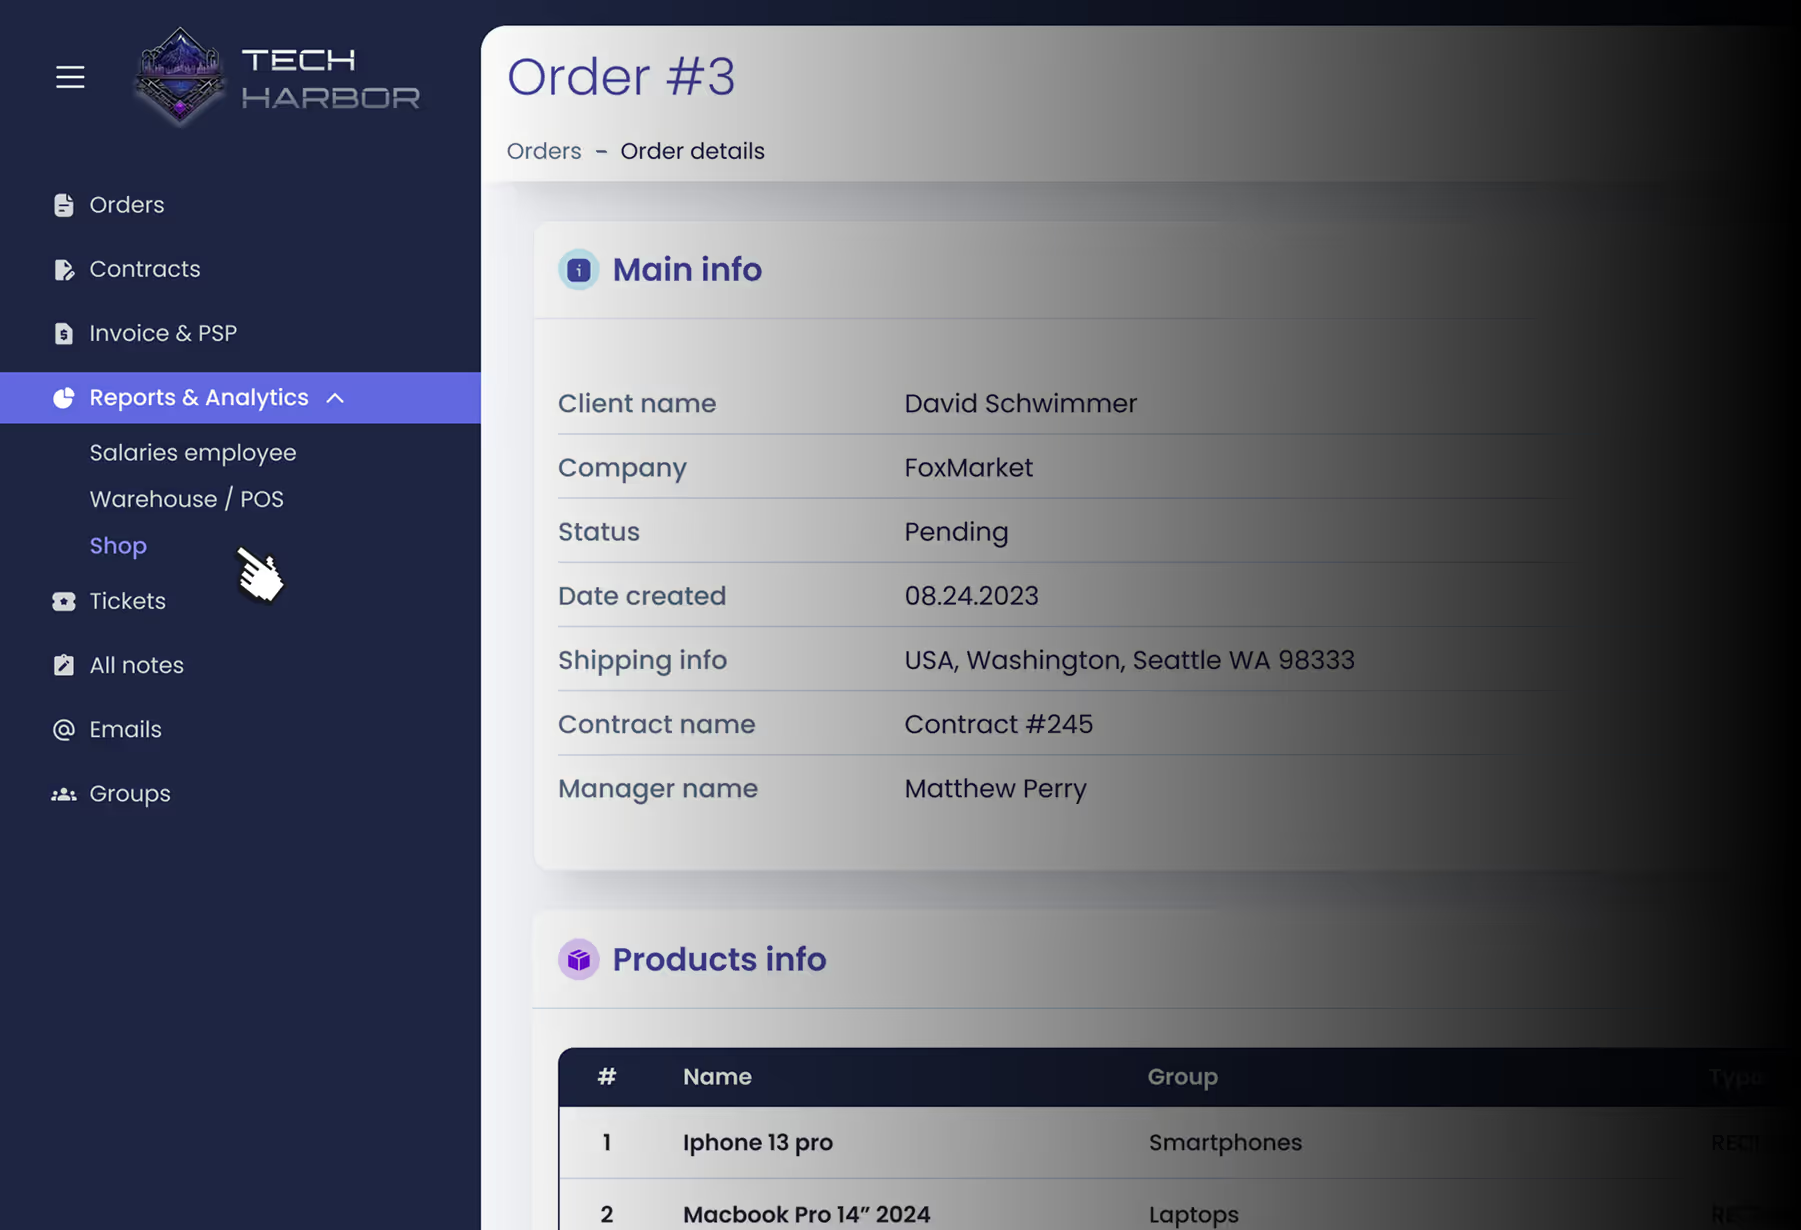
Navigation menu for the user "Finance Manager".
The Users of ERP System
The ERP system serves business owners, executives, sales teams, legal experts, warehouse managers, and accountants, ensuring smooth workflow automation and collaboration. International distributors also rely on it for real-time data access.
David, a co-owner of a global business, seeks an integrated system to manage operations efficiently. He values fast task execution across devices but faces challenges like large interface texts on mobile and limited distributor data editing, highlighting the need for ongoing improvements.

CEO
"I use the ERP system to monitor finances and key business metrics. It helps automate routine processes and speeds up decision-making."

International Lawyer
"The ERP system streamlines my work with legal documents and contracts, ensuring compliance and efficient document management."

Sales Representative
"I use the ERP to manage client relationships, track deals, and analyze sales, making my job much easier."

Warehouse Manager
"The system helps me track inventory in real time, reducing errors and preventing stock shortages."

Accountant
"The ERP automates financial management, making expense tracking, invoicing, and financial planning more efficient."
User Research: Pain Points
Convenience
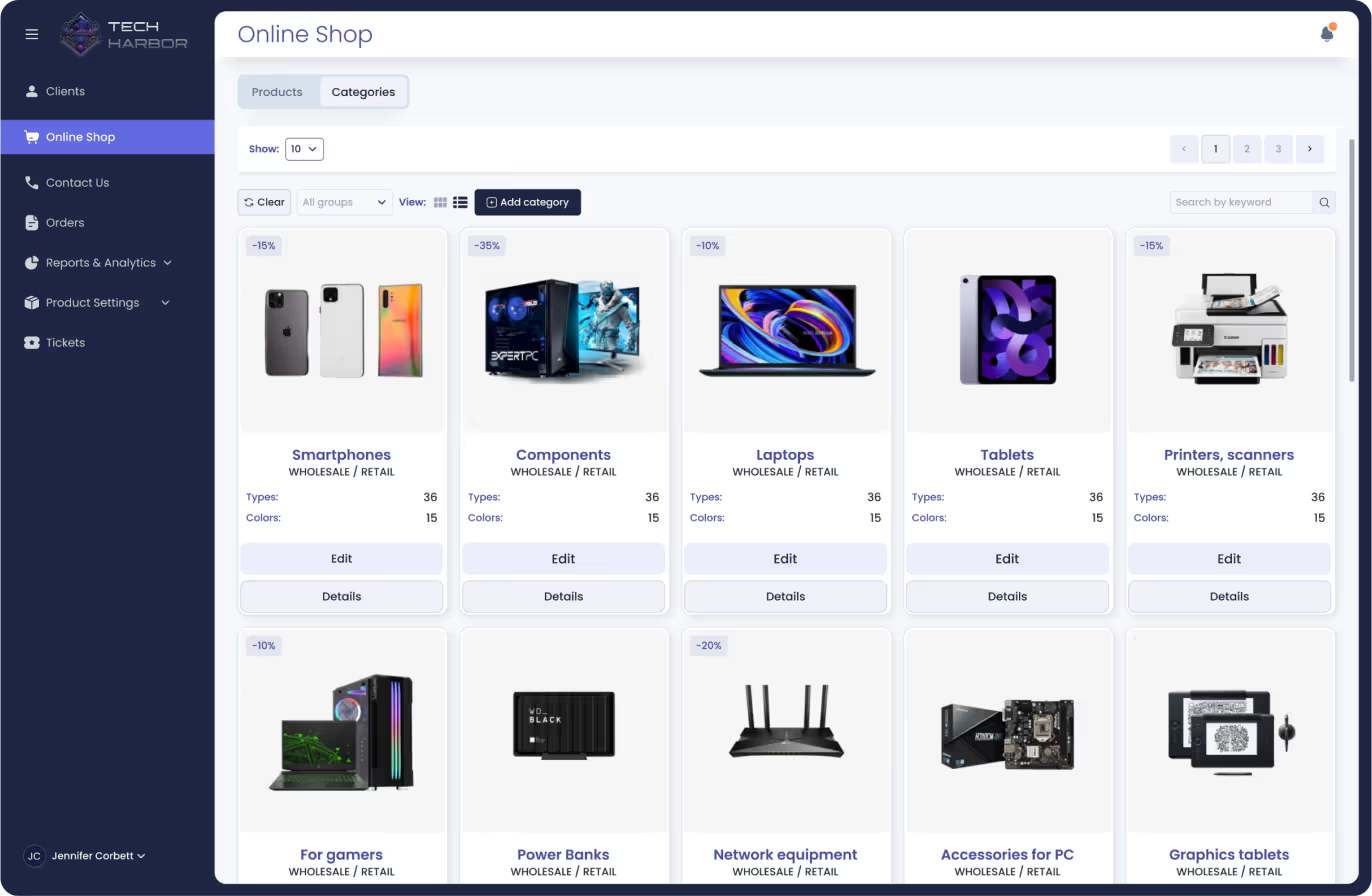
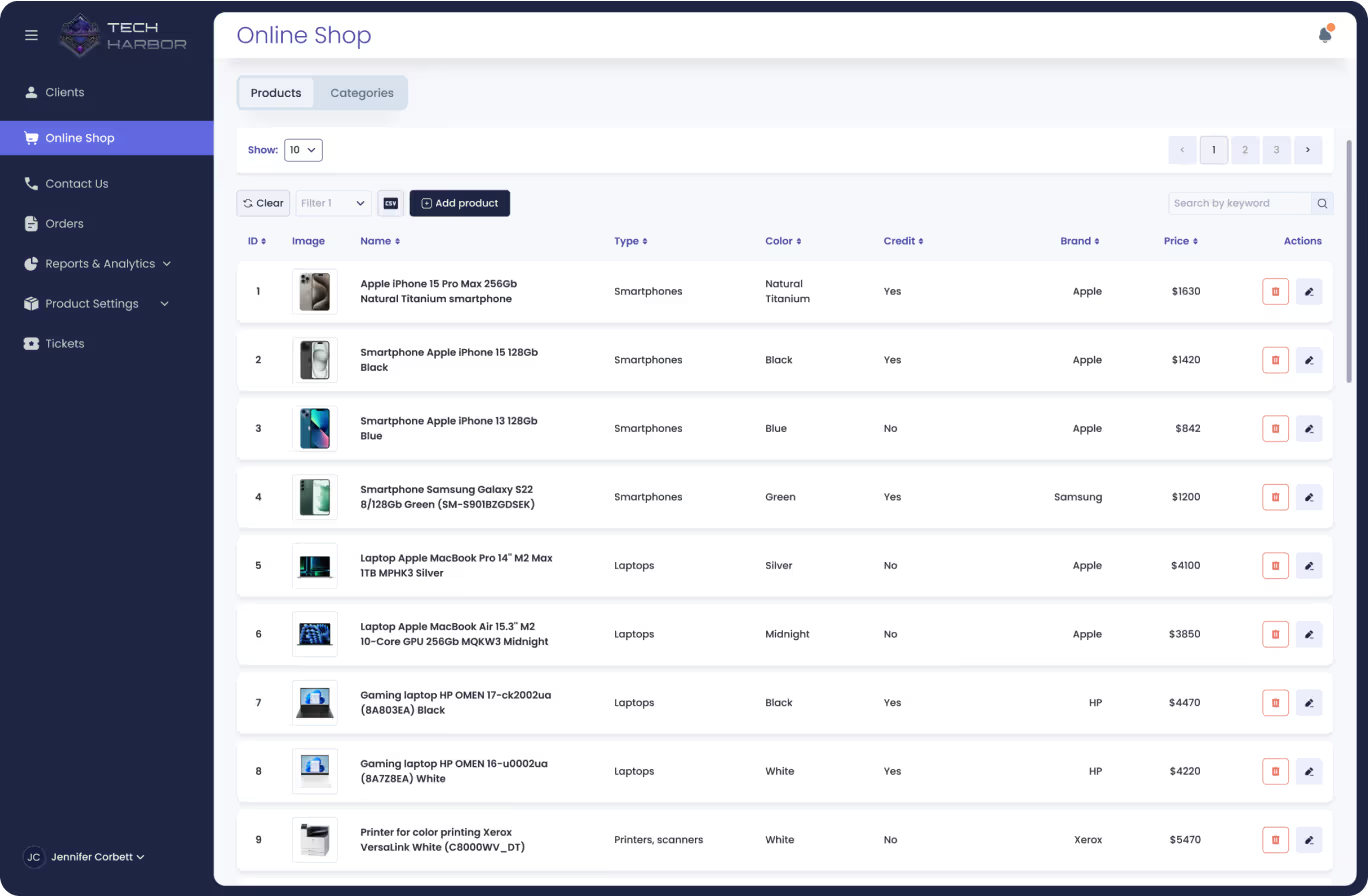
The interface is built with tables and cards, ensuring a clear and intuitive experience.
Trust
"This service must be safe for our business and our distributors." (David)
Navigation
Users suggested adding breadcrumbs to screens for easier backtracking.
Accessibility
The system supports night/day themes, text resizing, and screen reading.
Digital Wireframes
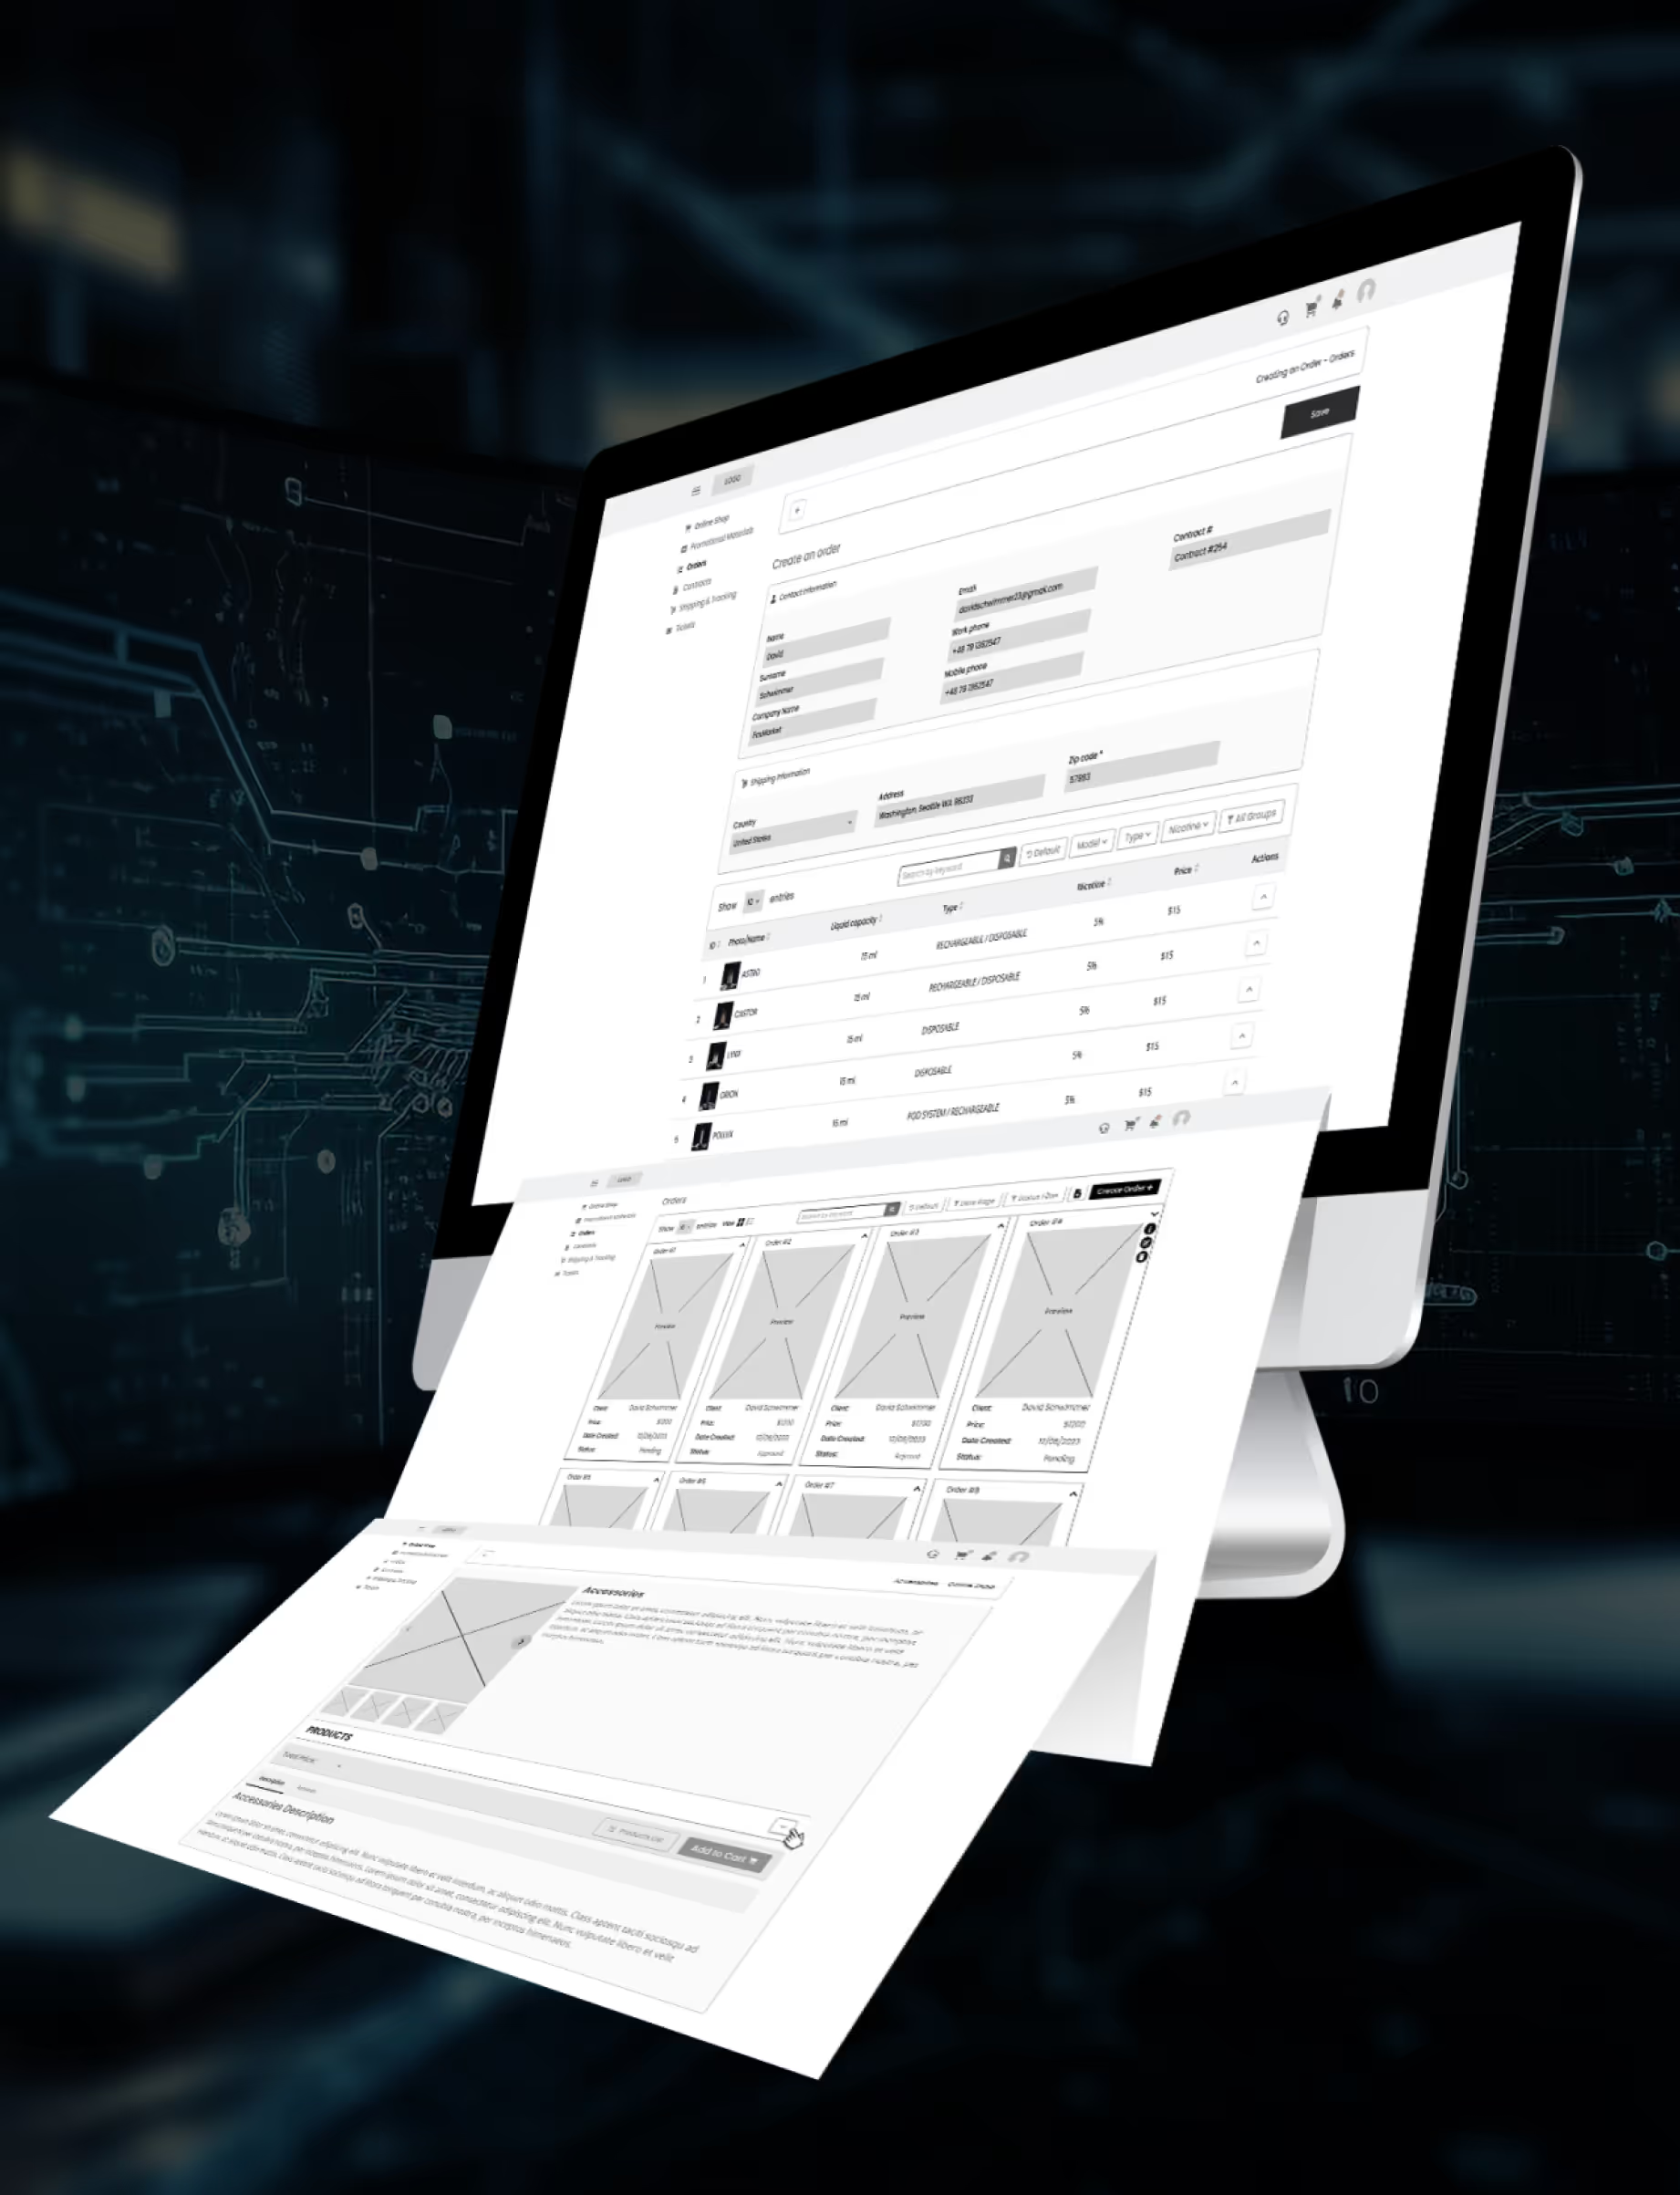
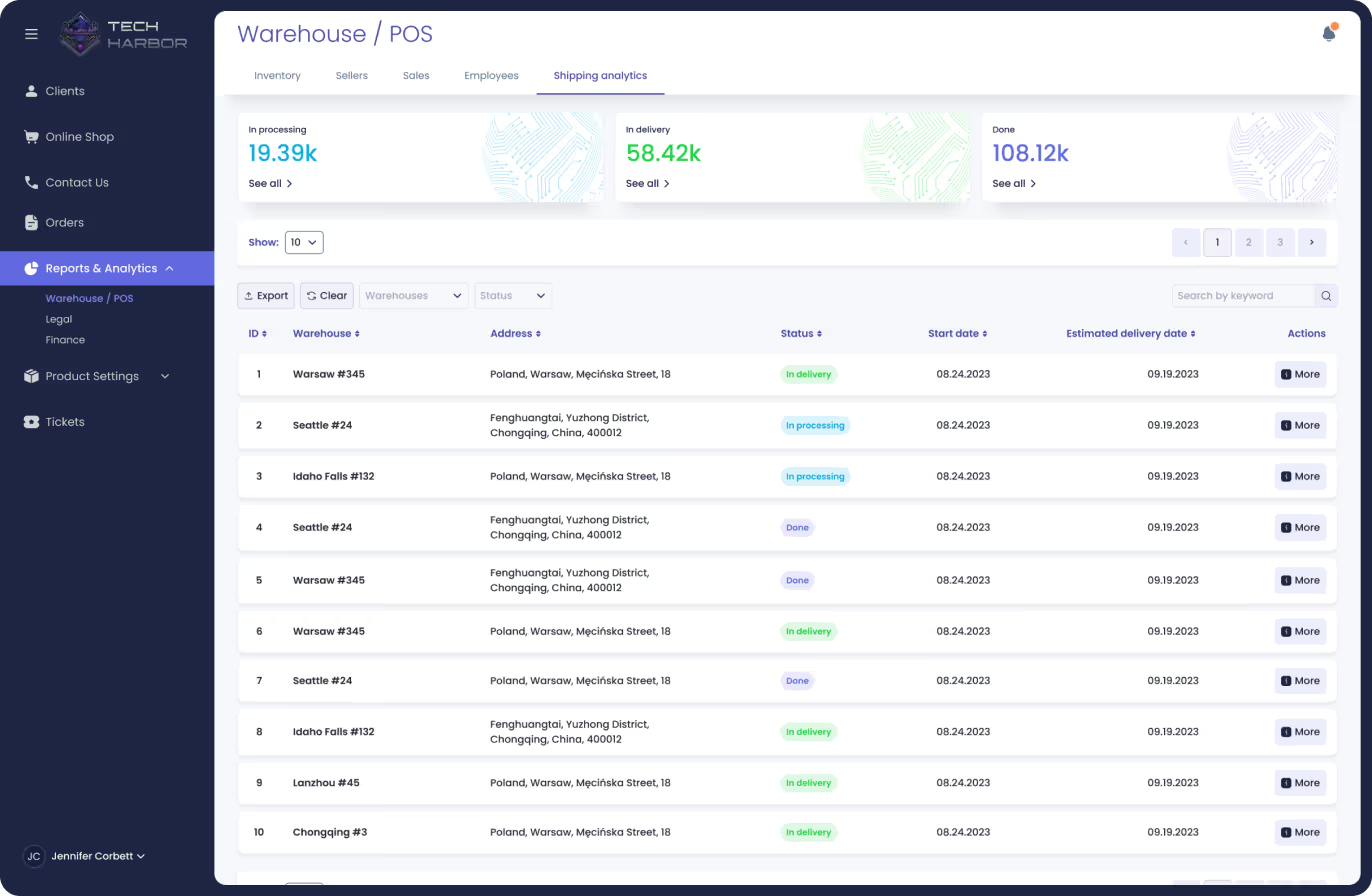
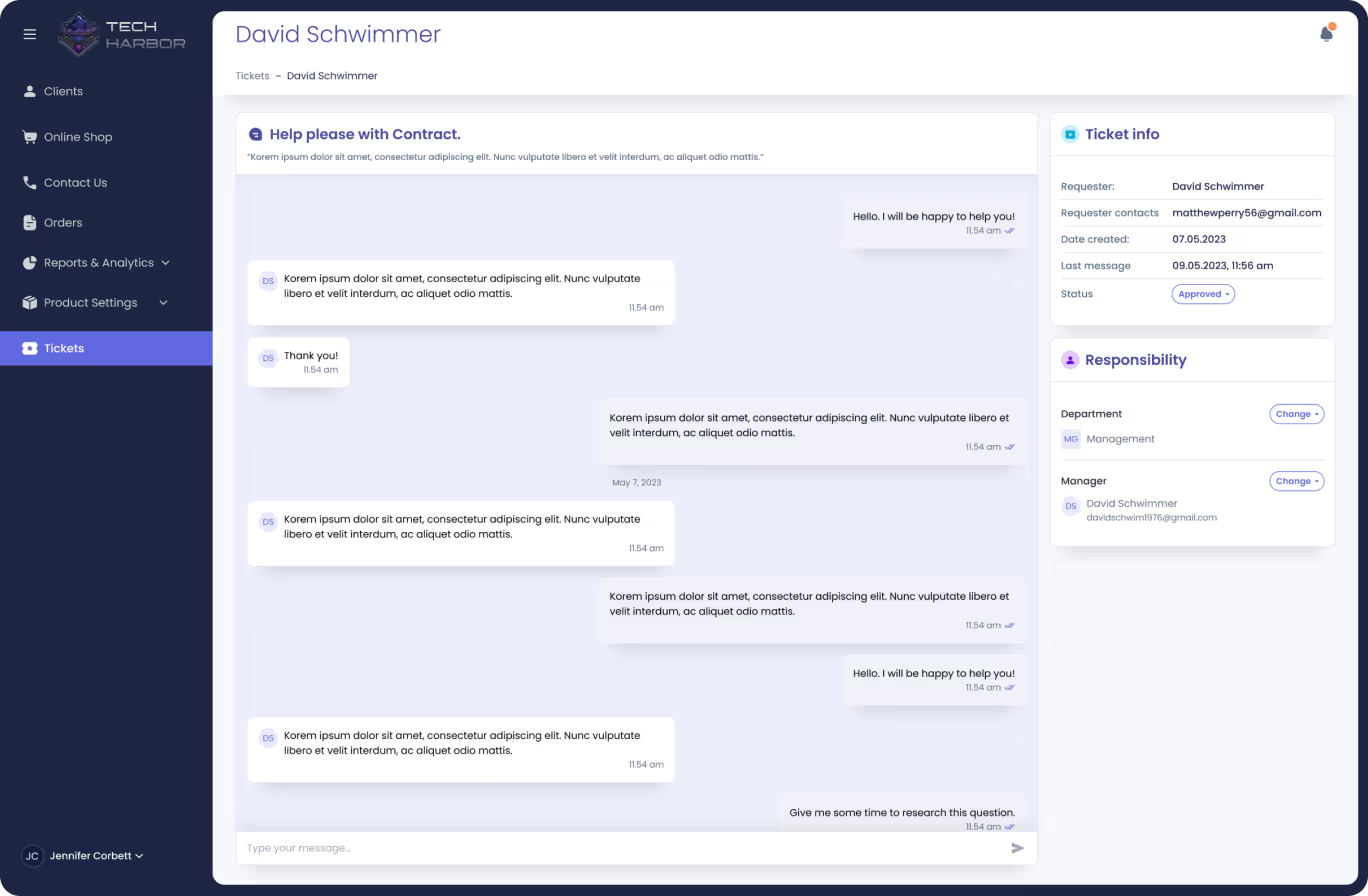
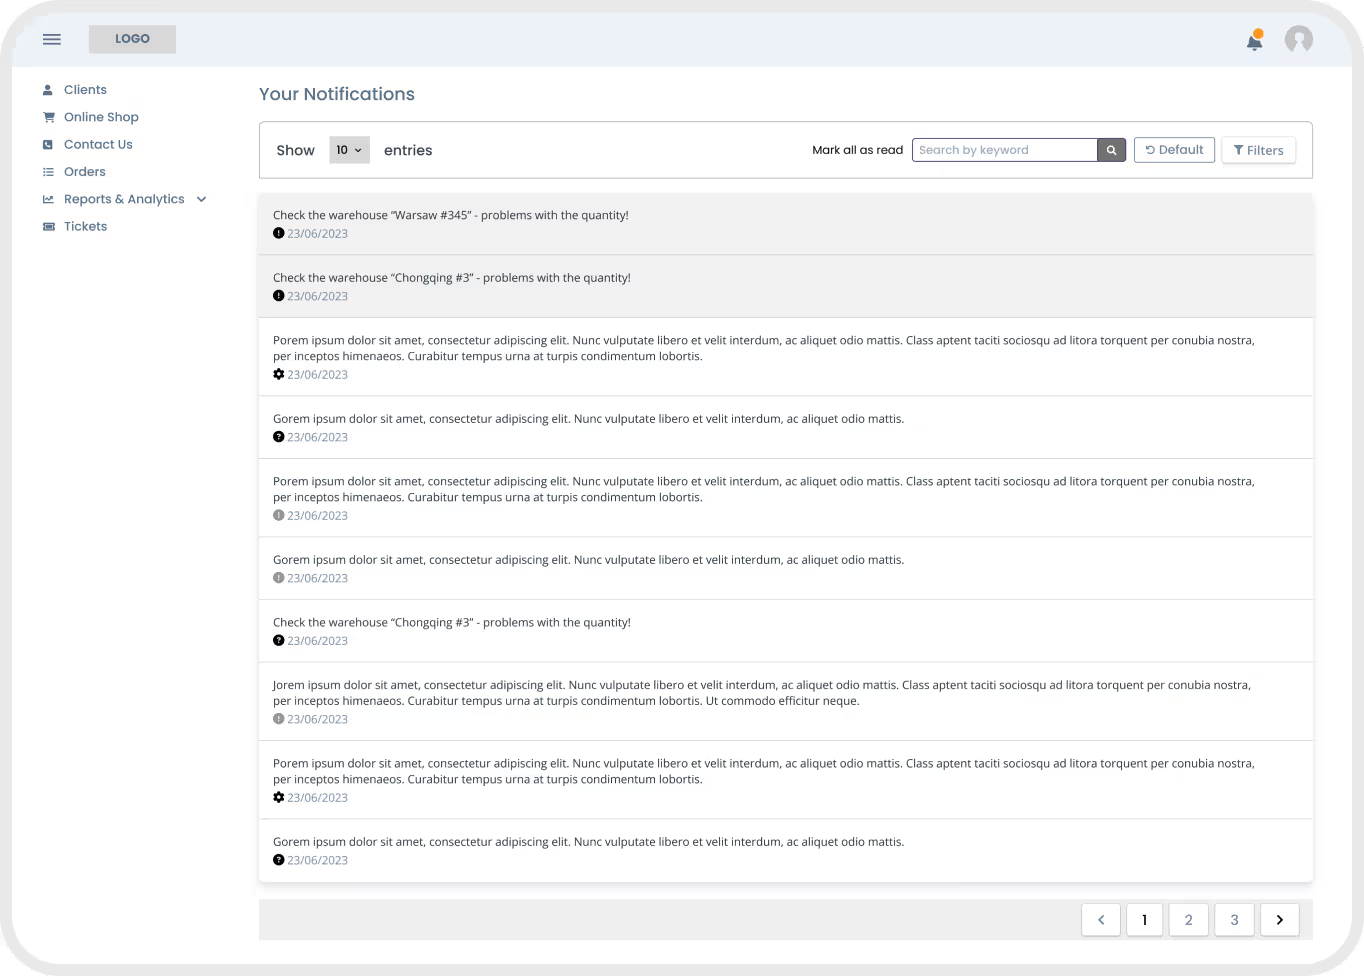
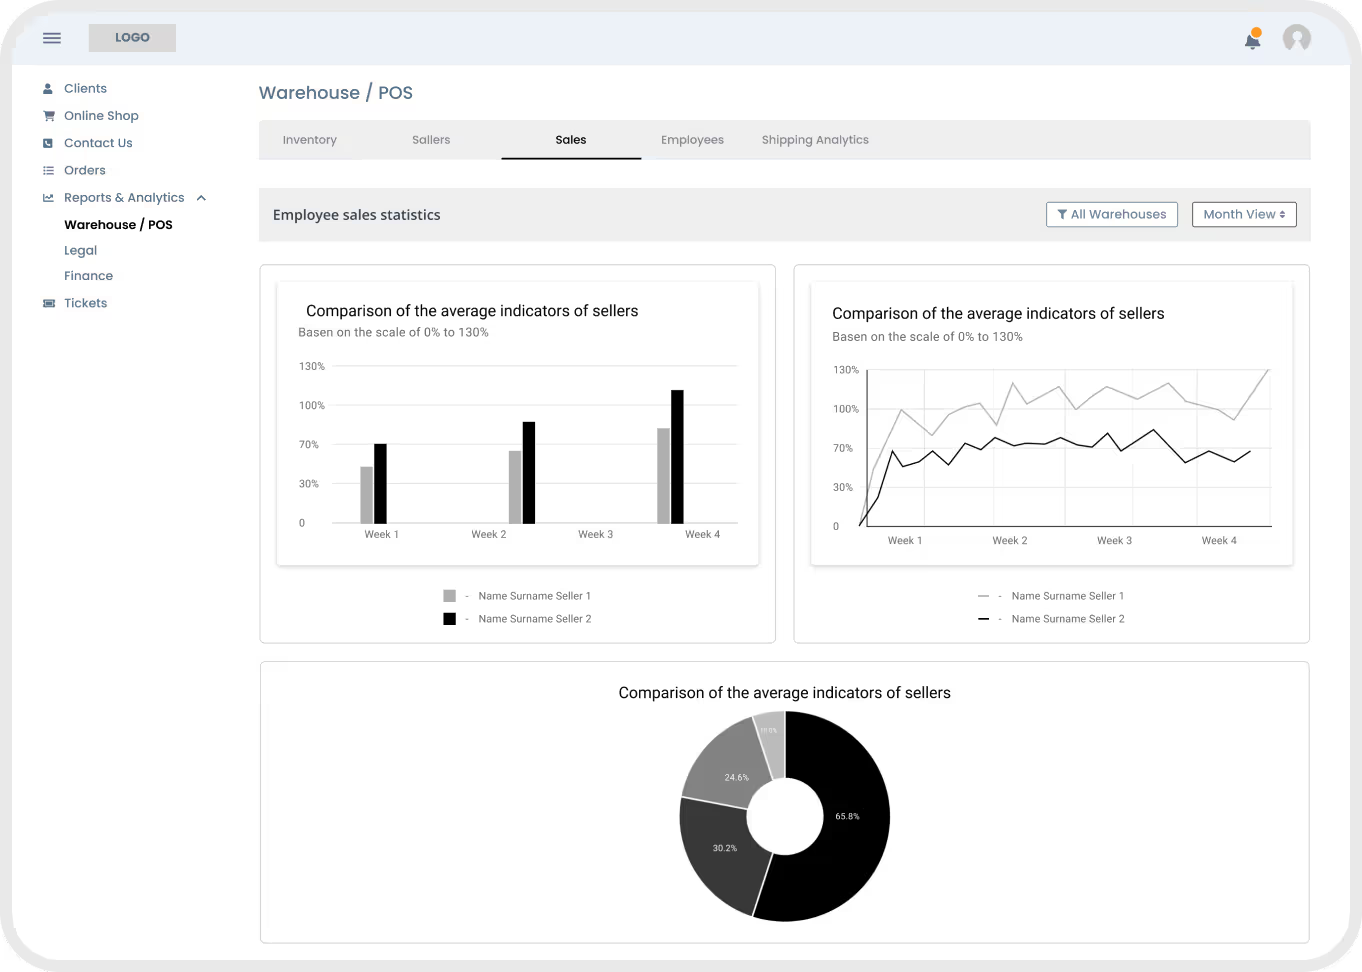
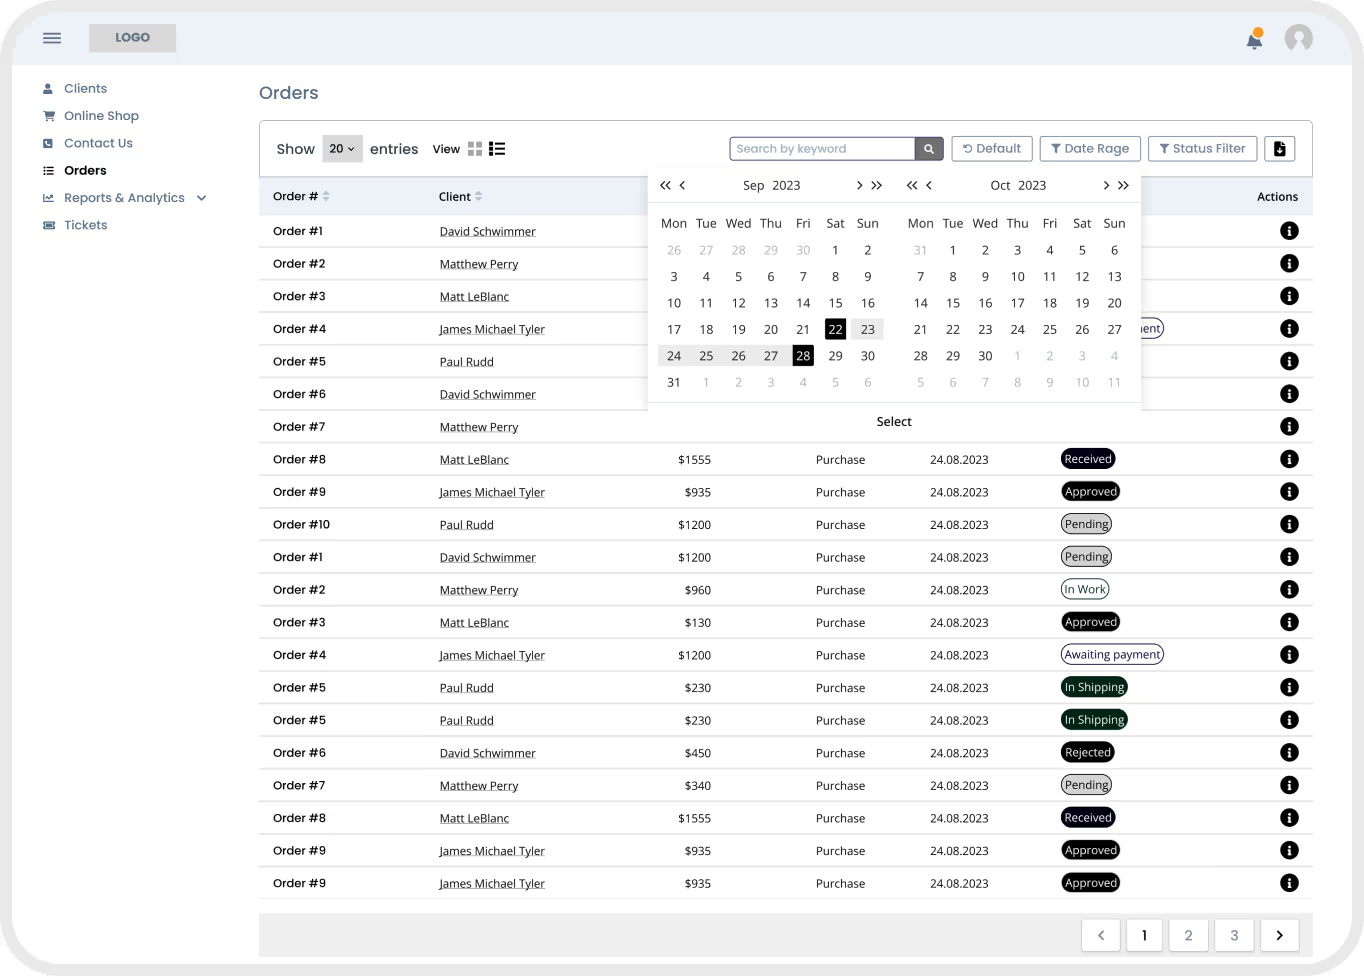
The ERP system consists of five departments plus a separate Distributor interface (six modules in total). I created wireframes of all the screens and mapped user paths for each module.
I also worked closely with developers and team managers to understand the functionality of the system. We gathered for BRAINSTORMING SESSIONS and analyzed the design and logic of all departments.
Final Iteration
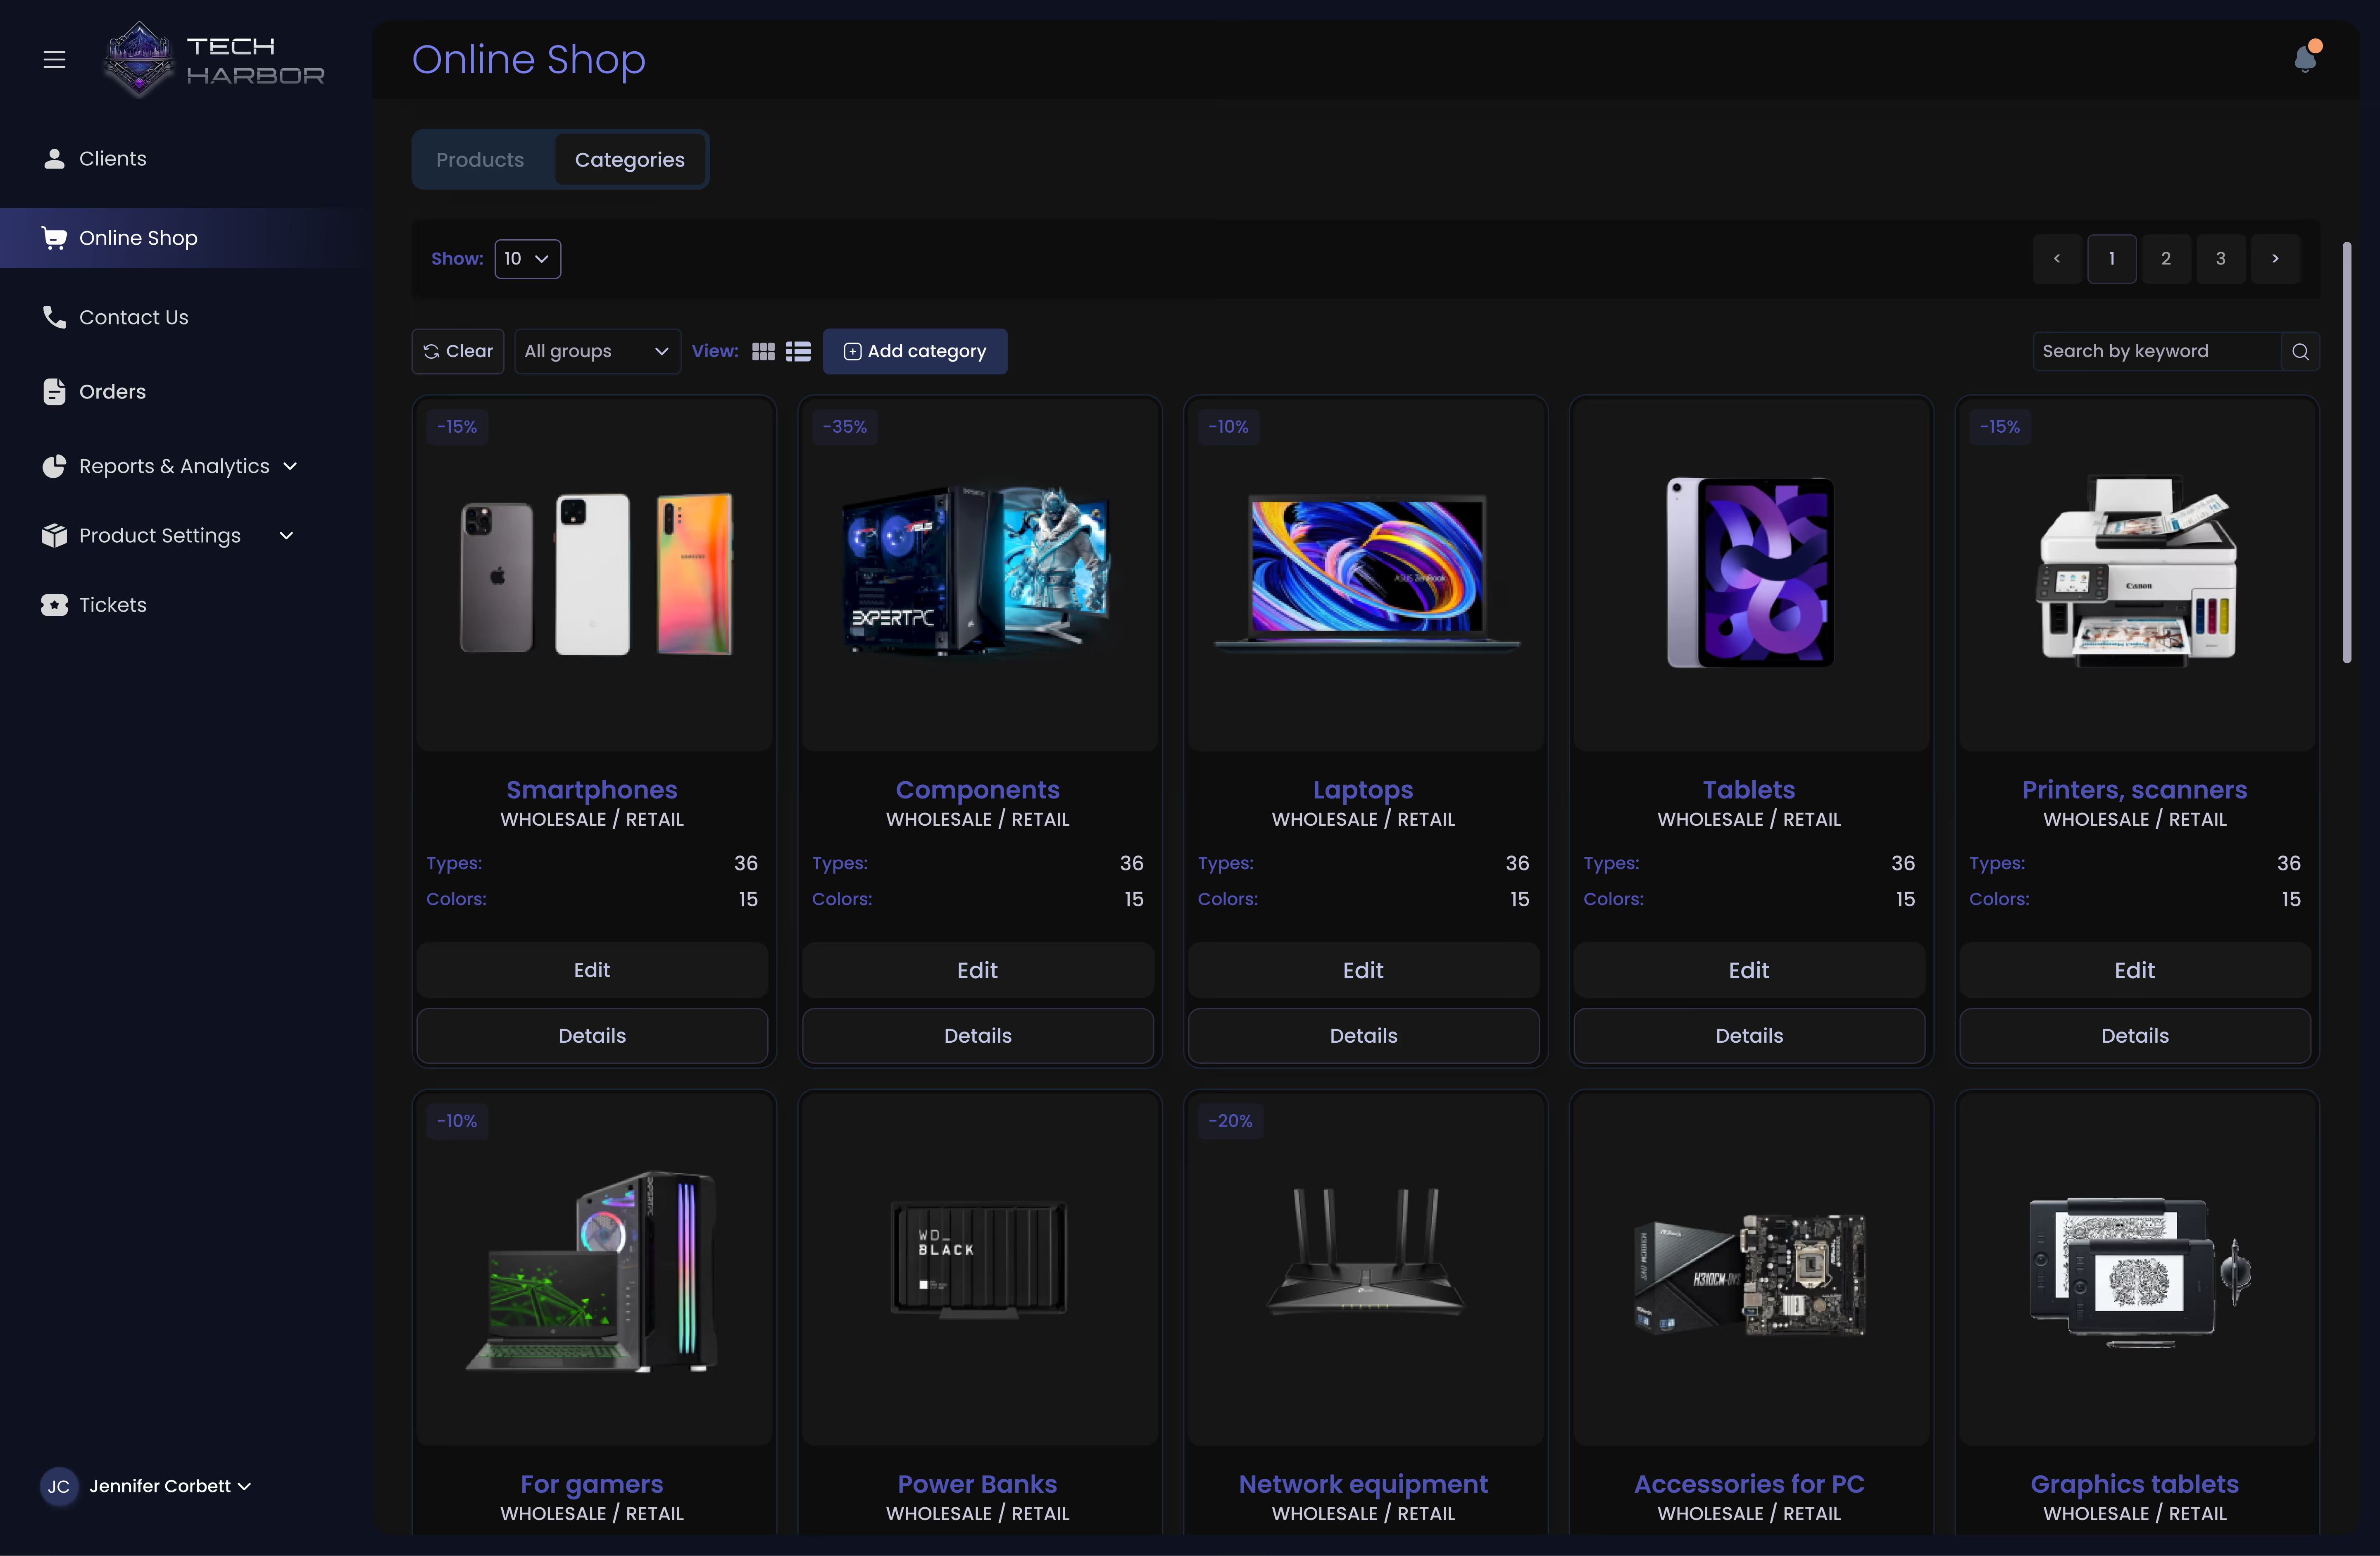
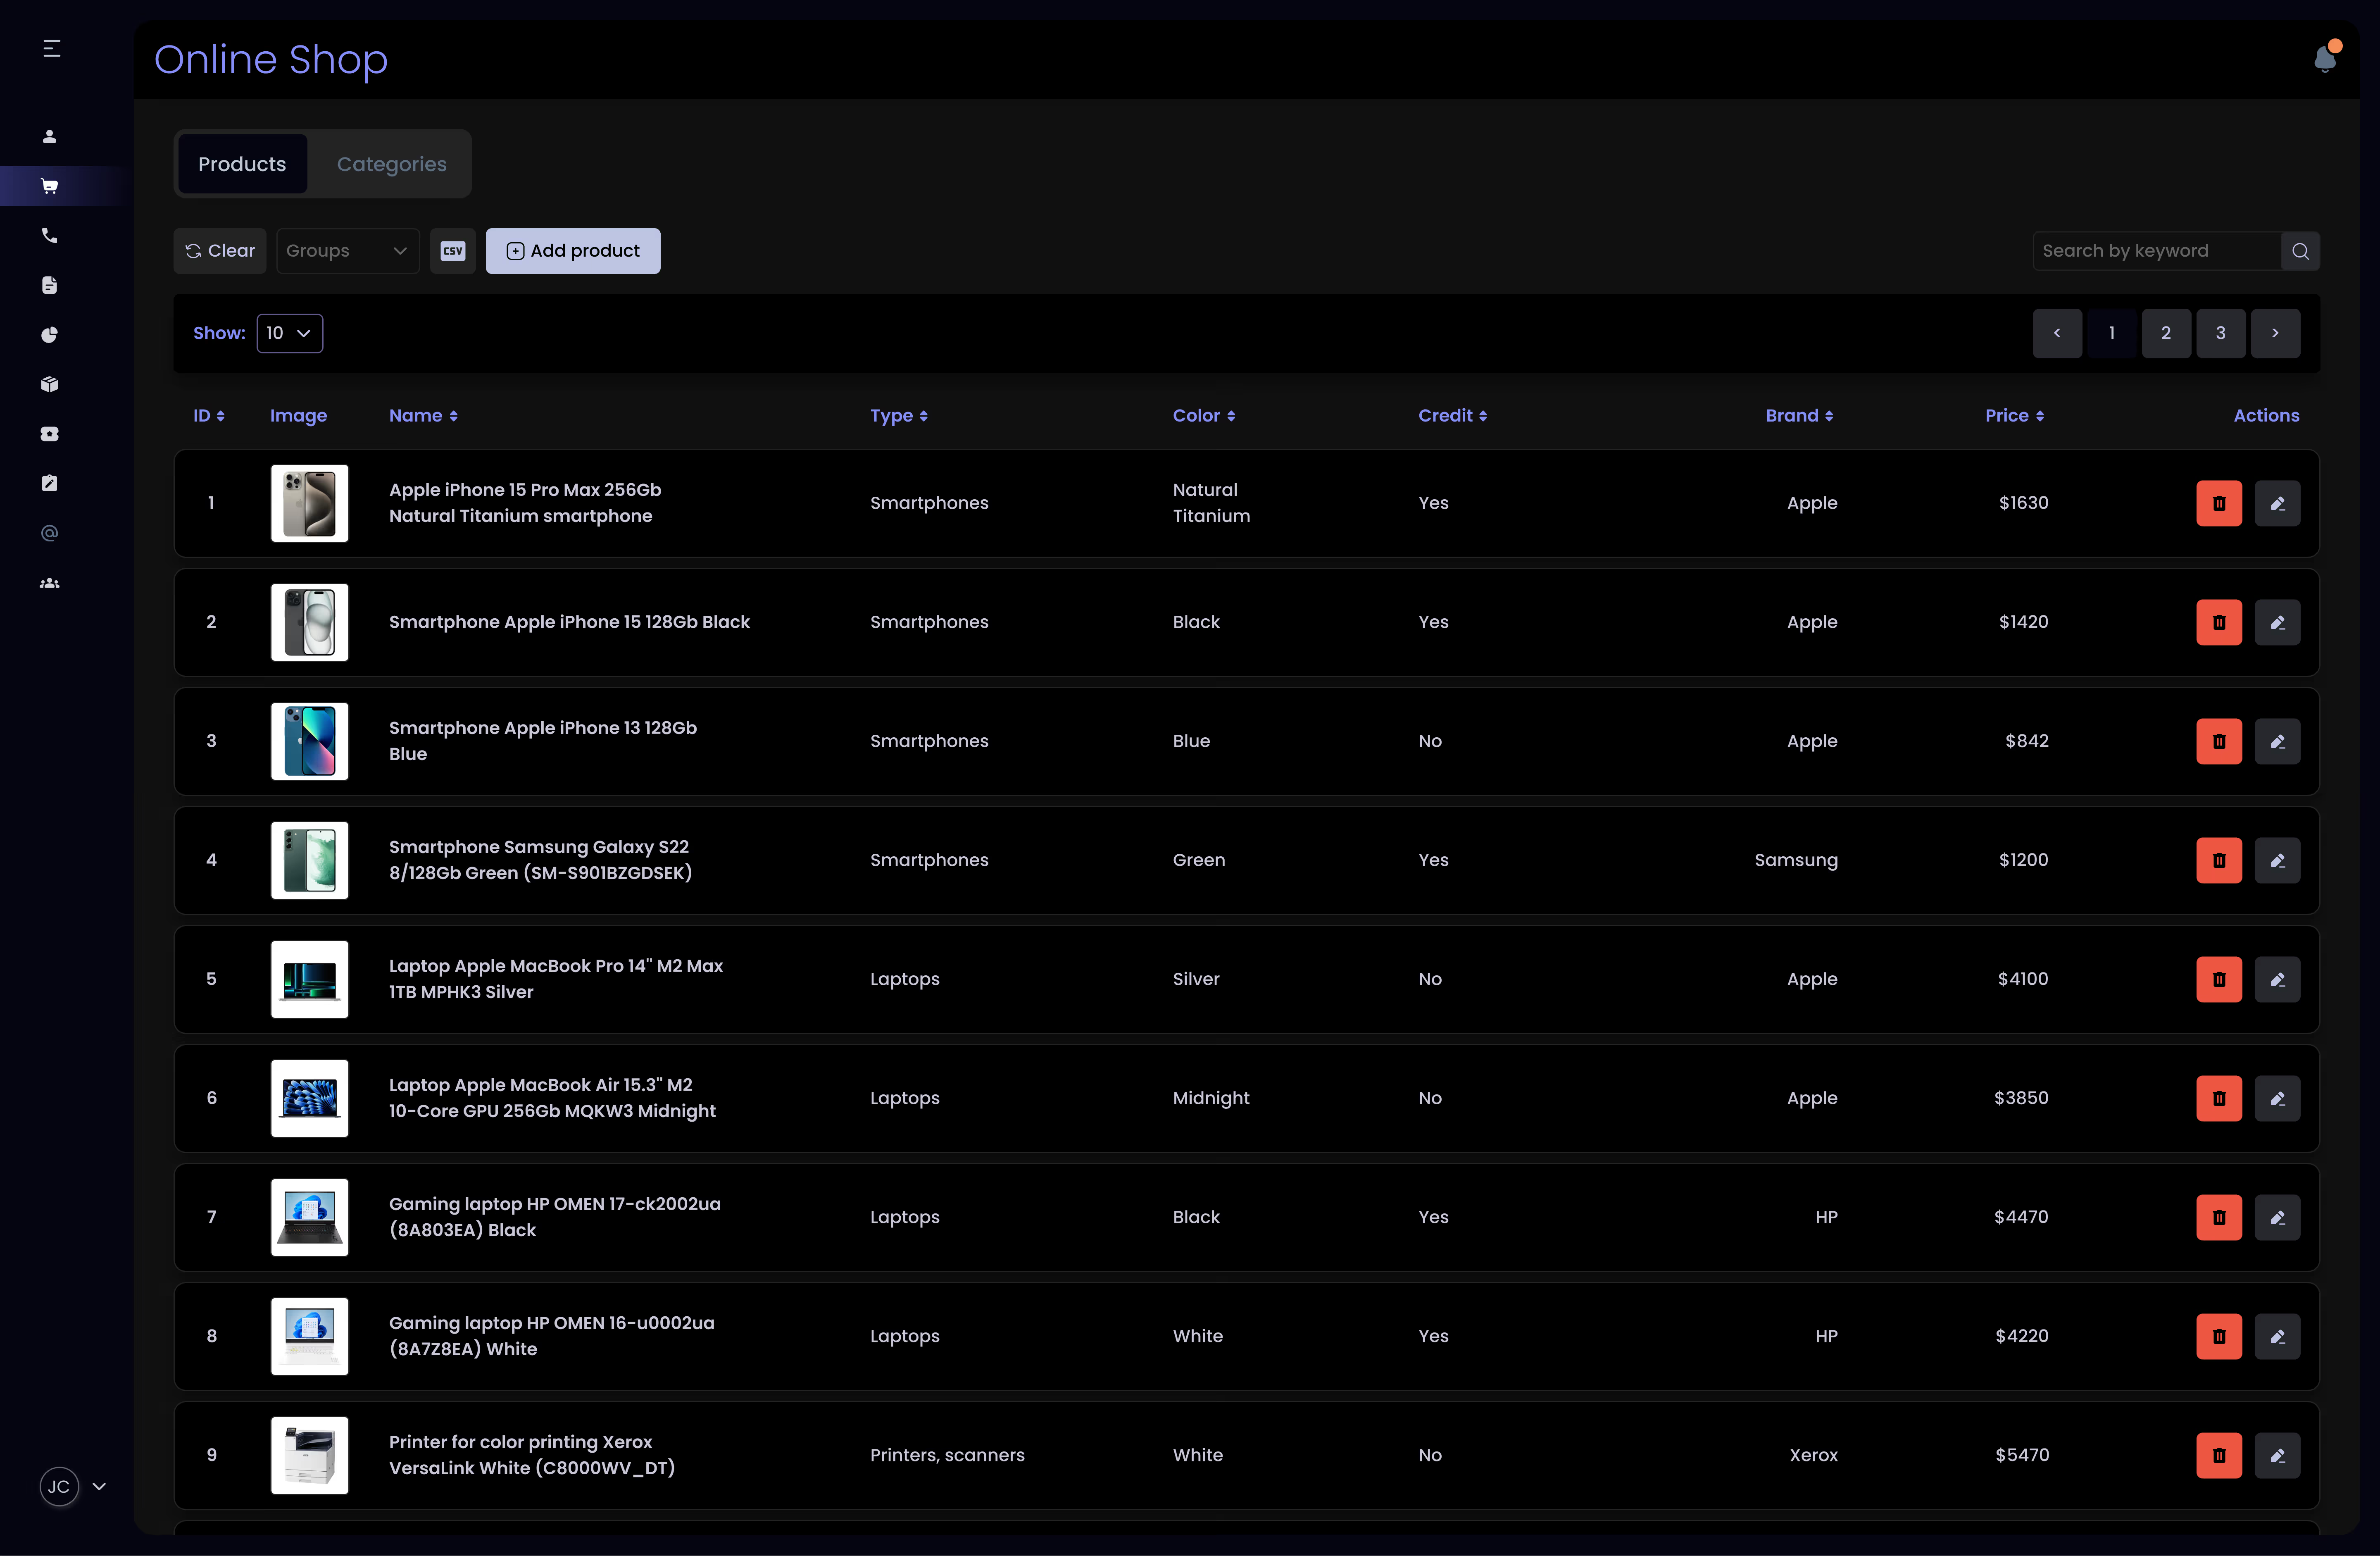
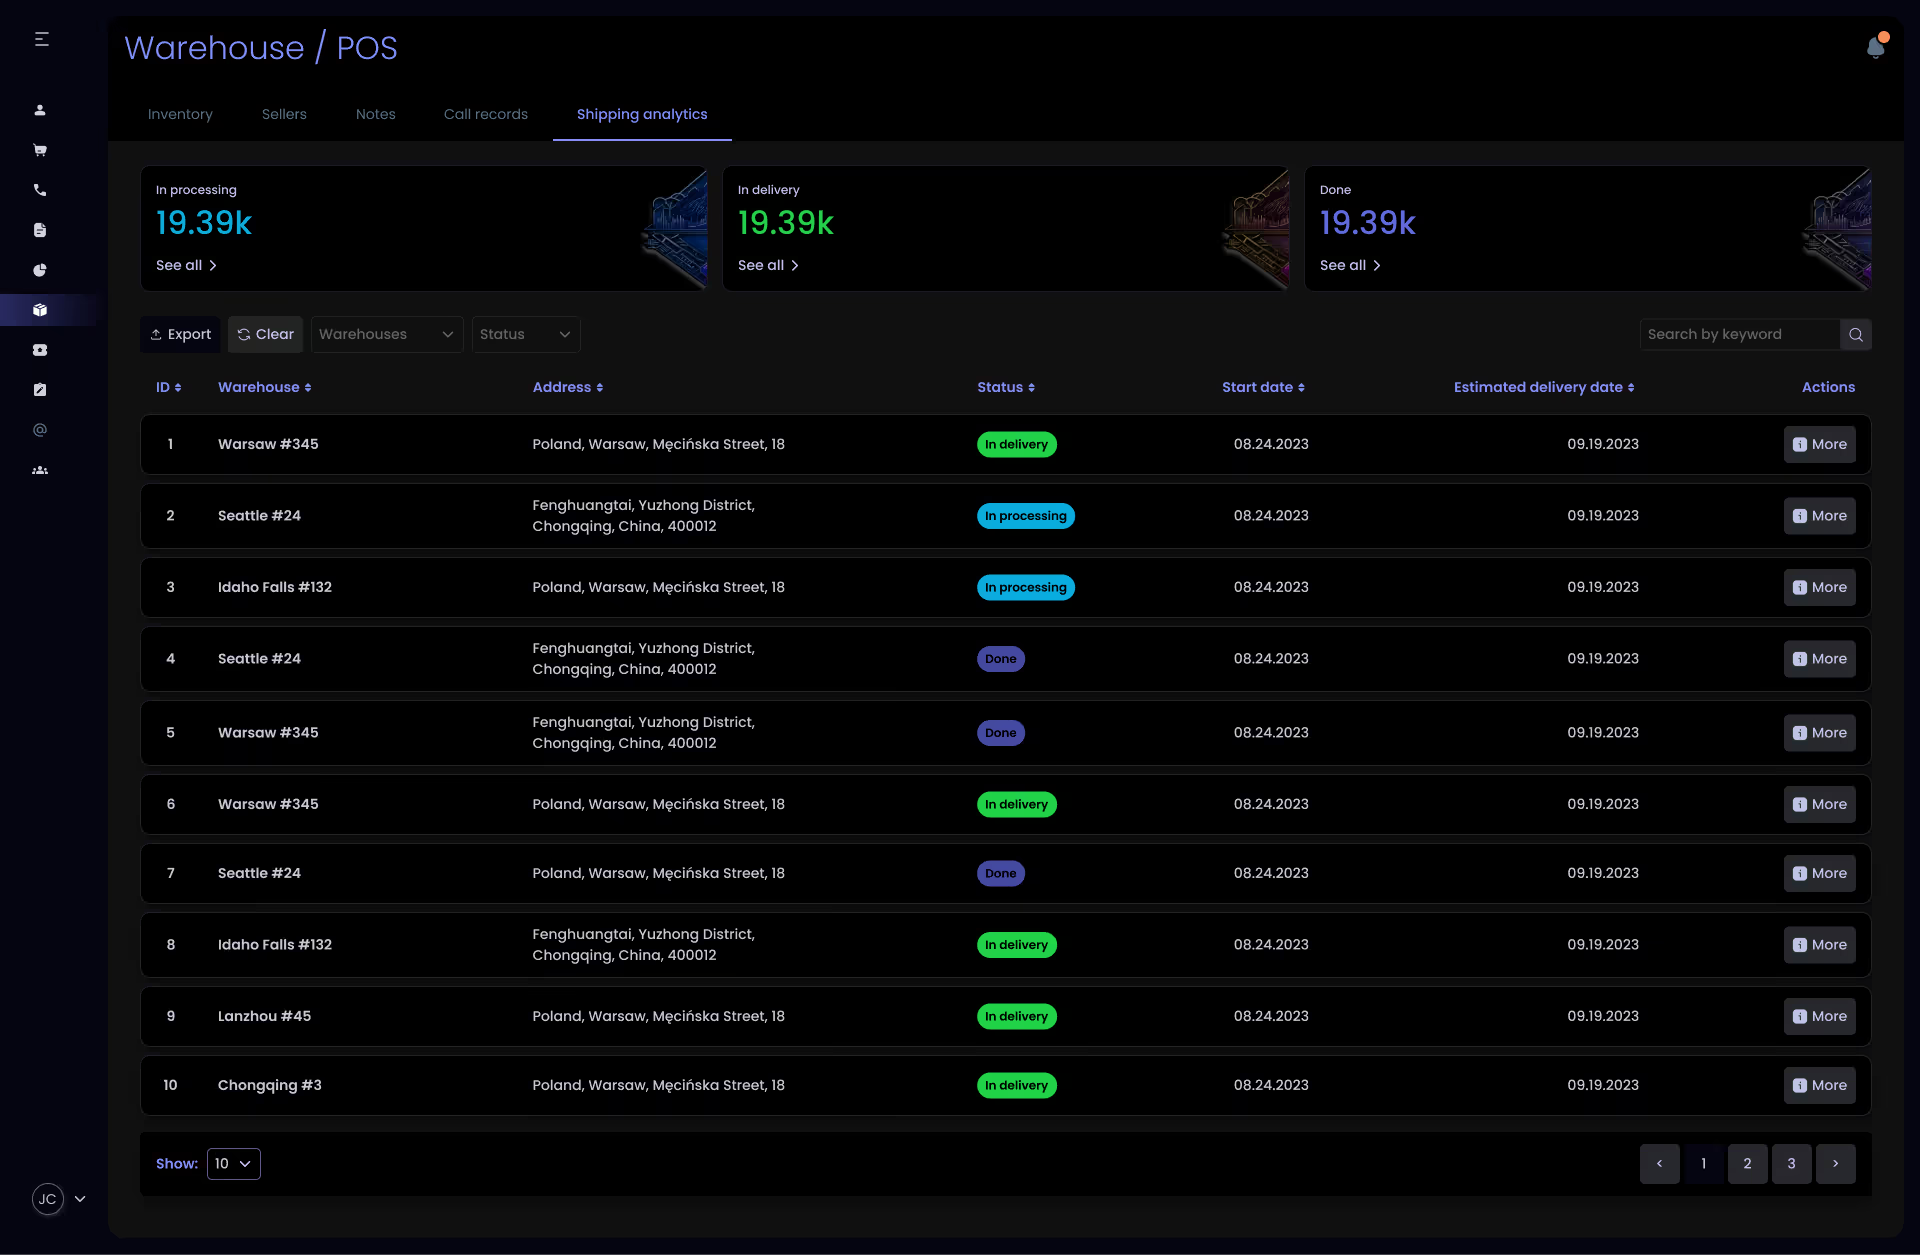
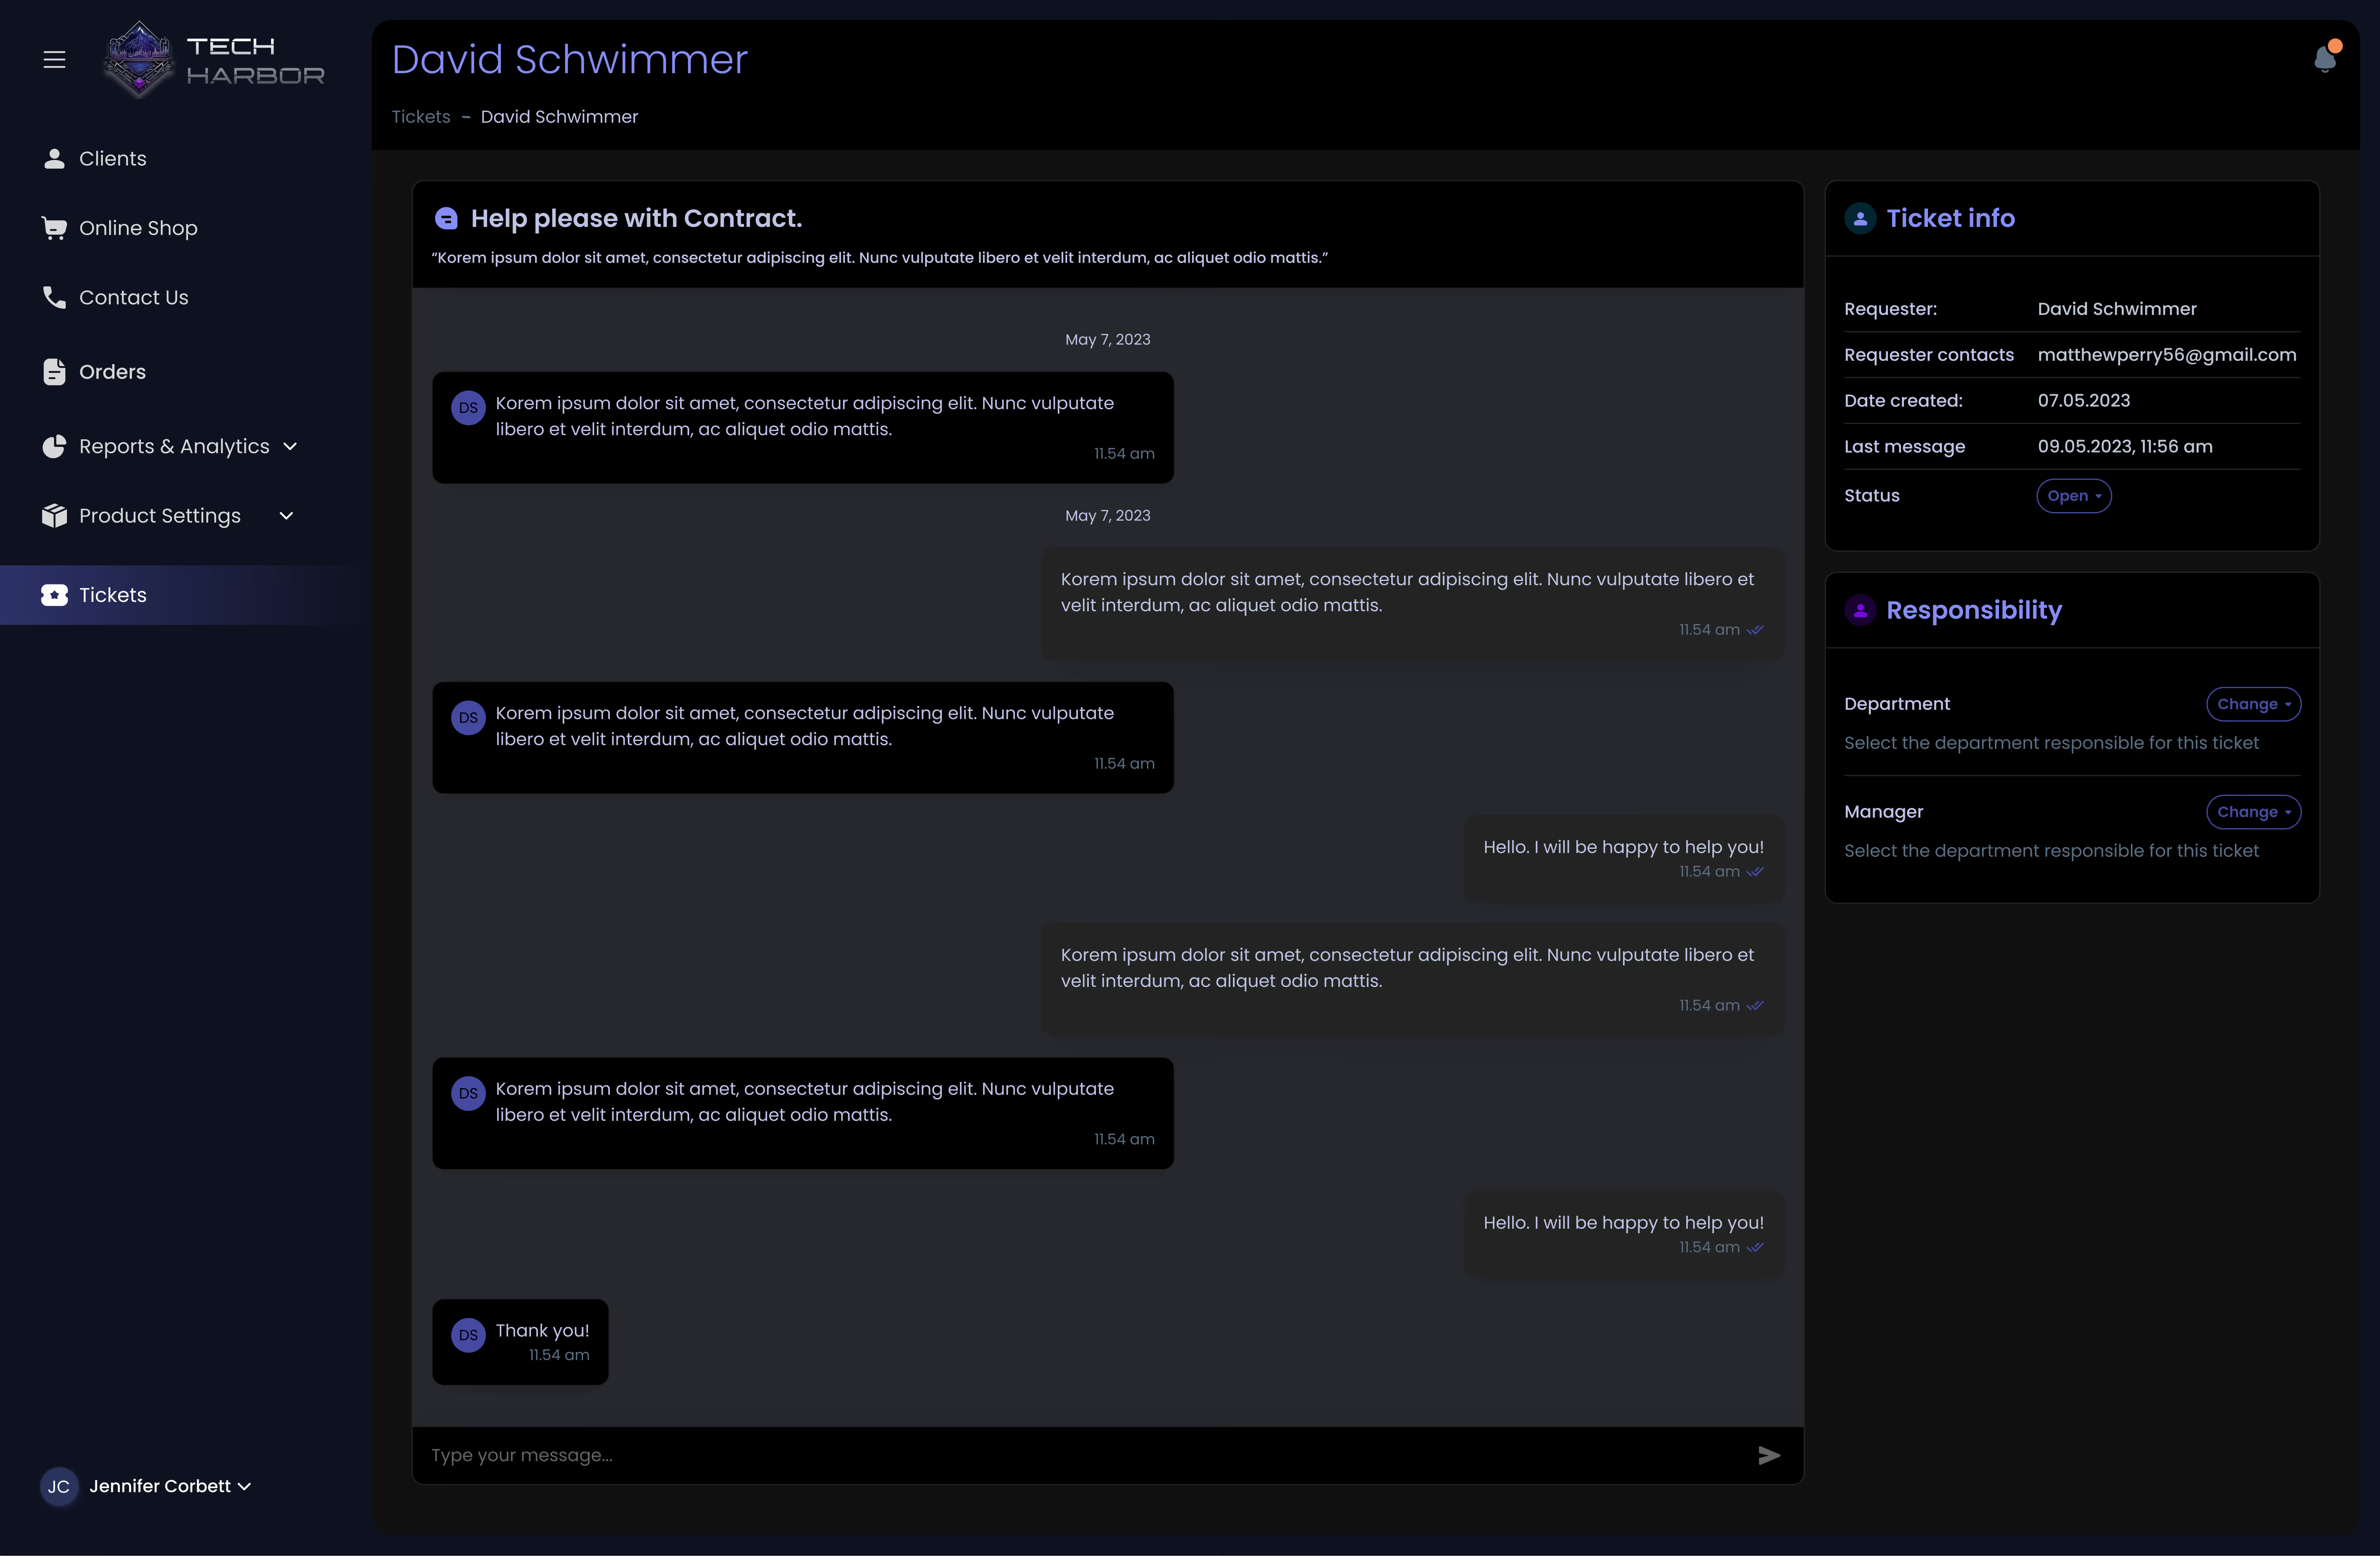
Mockups
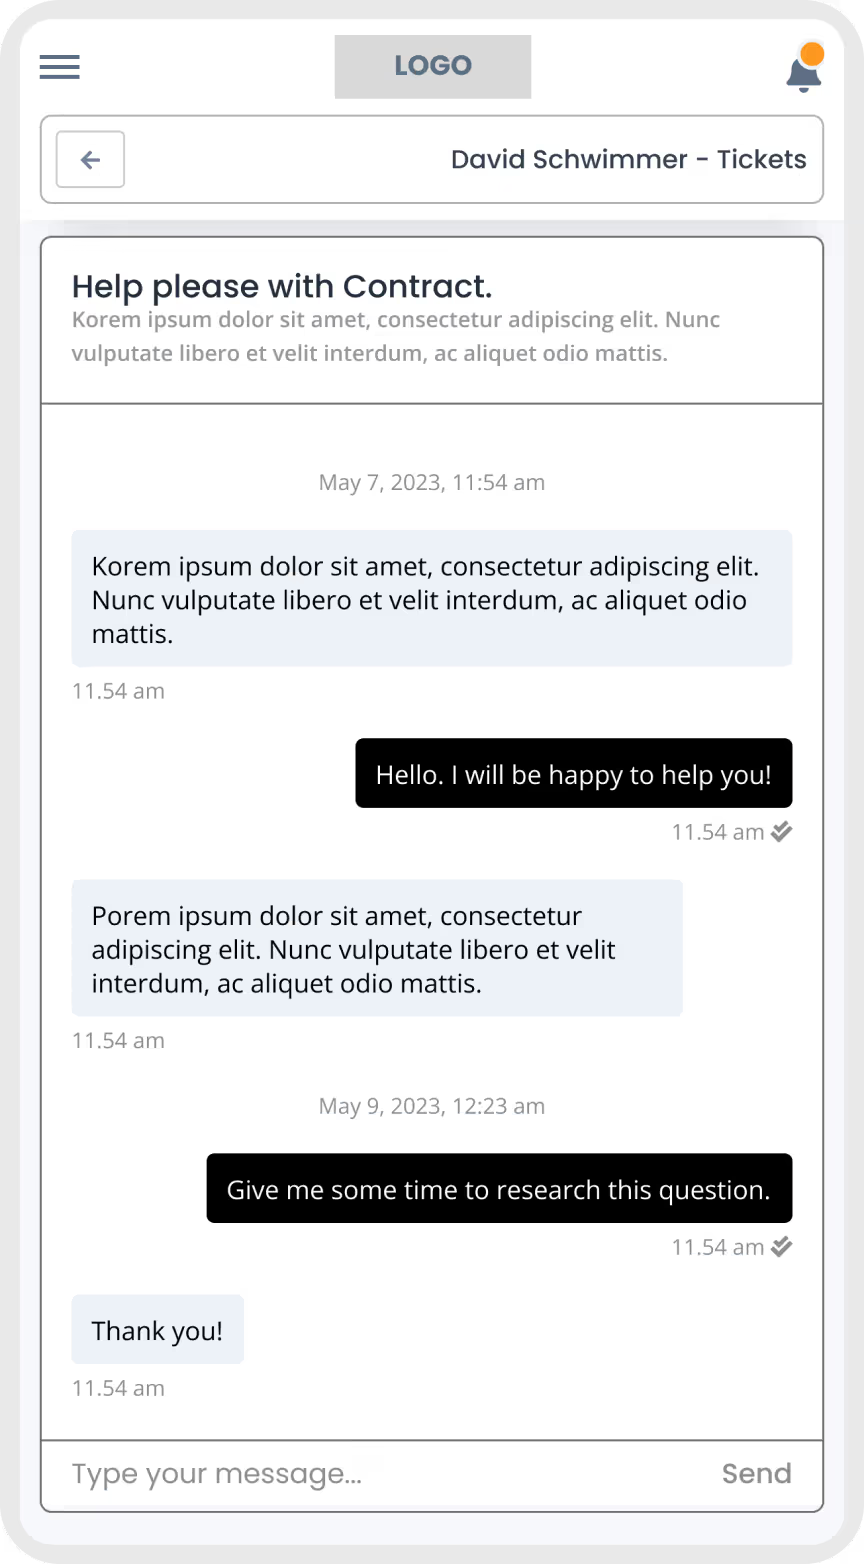
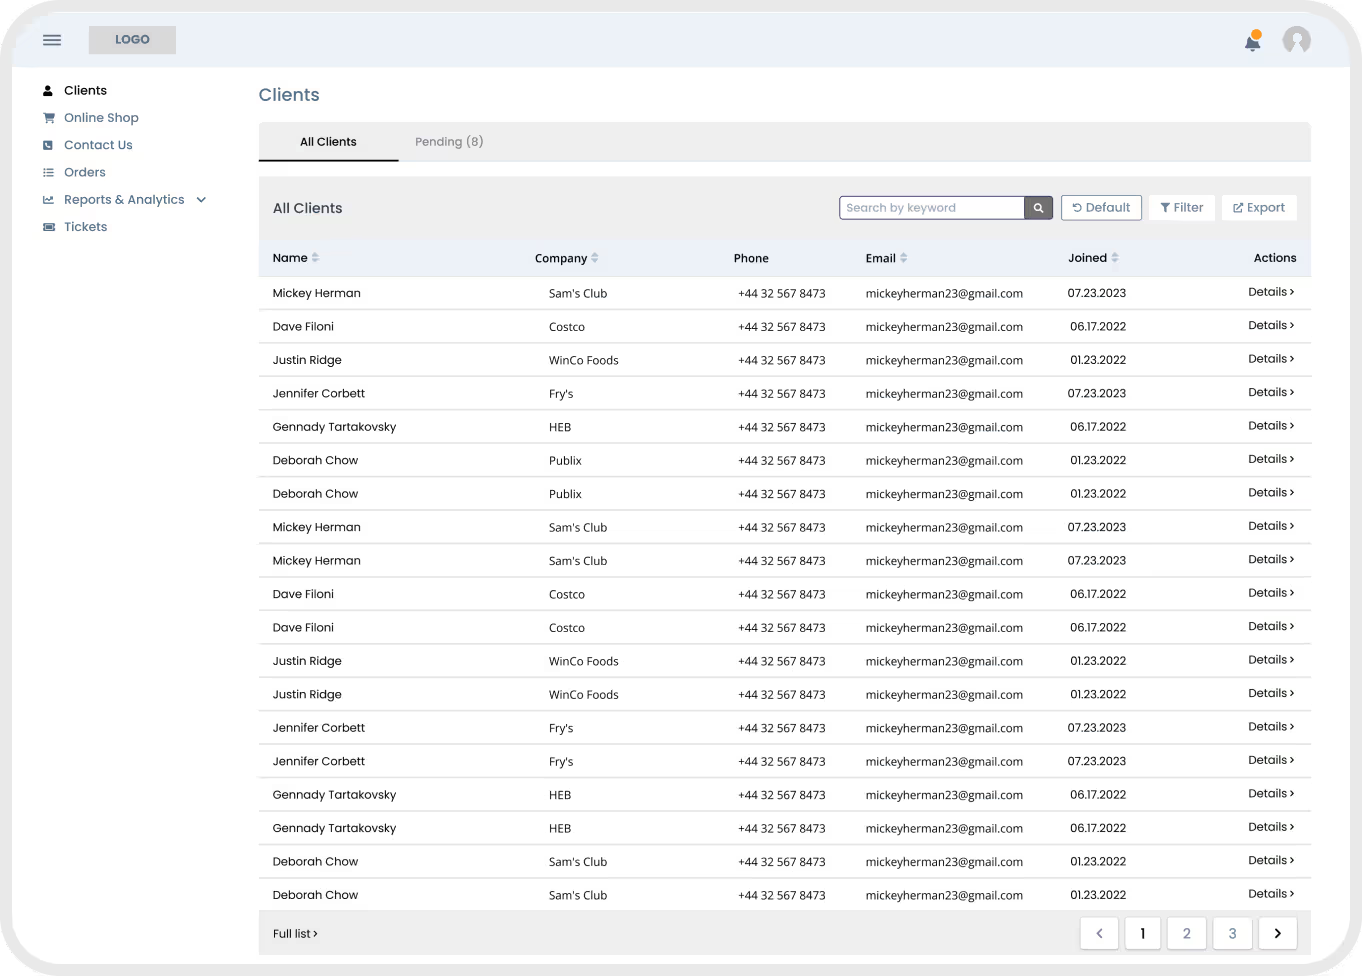
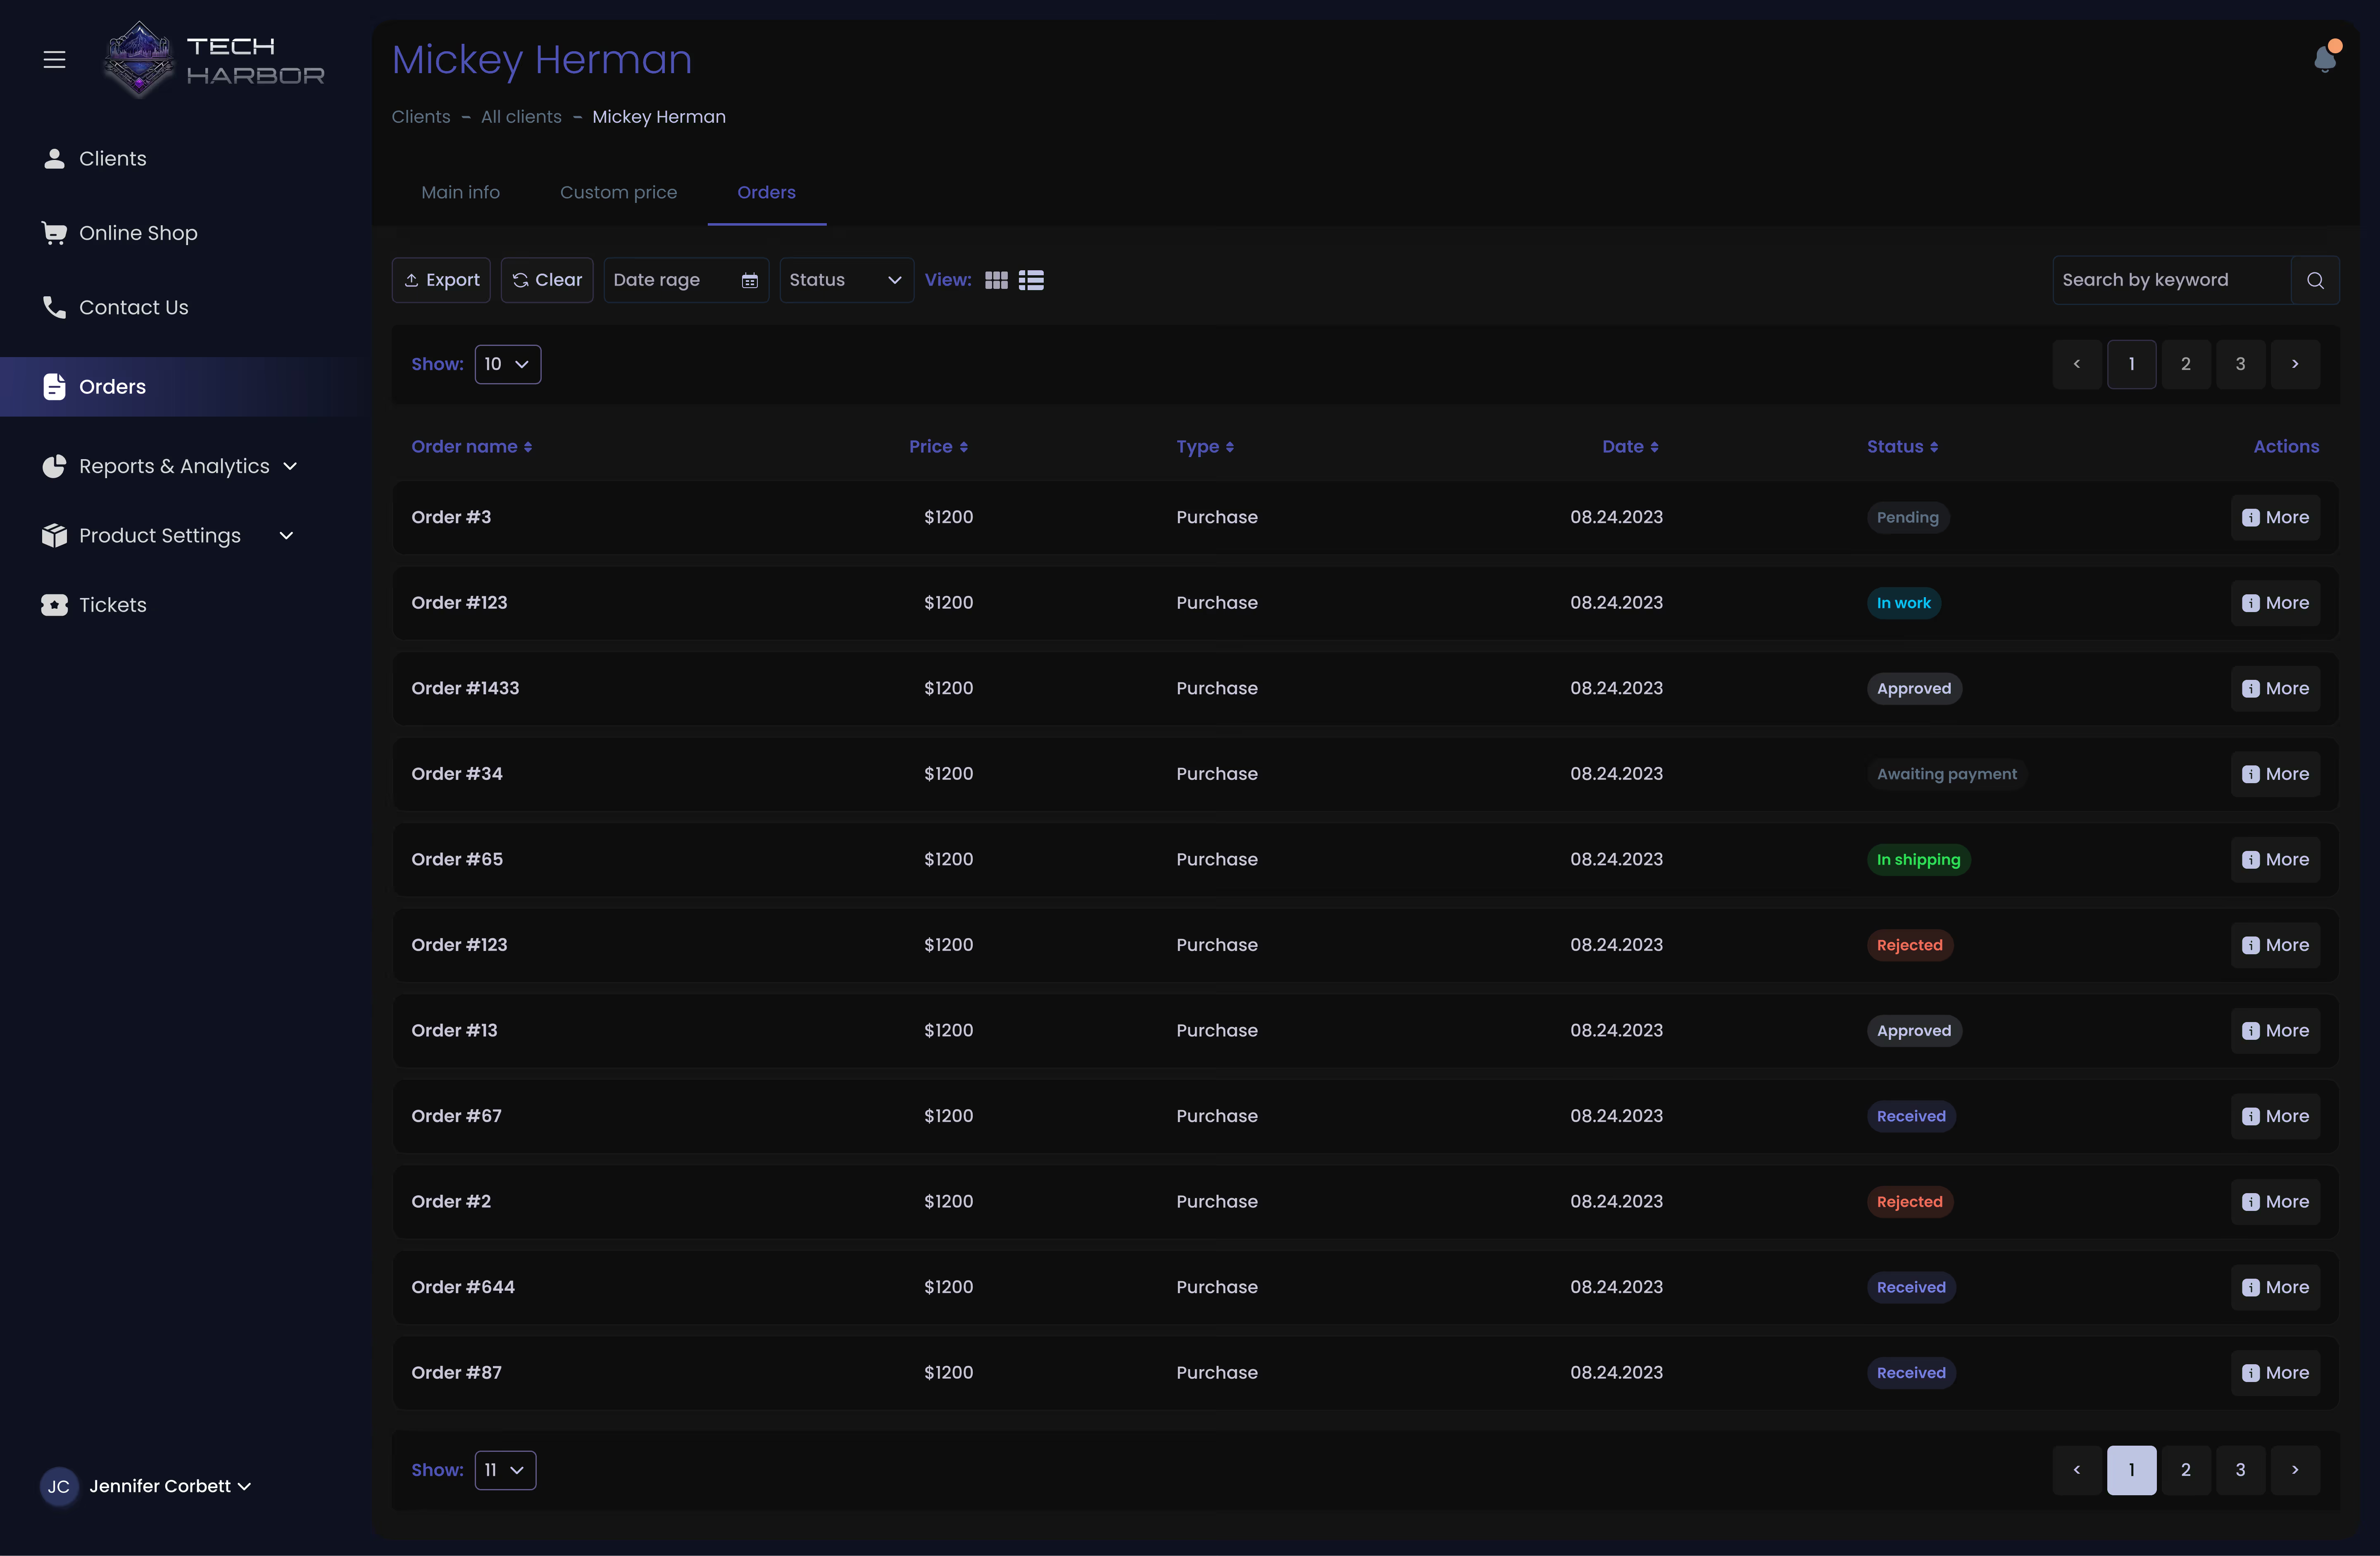
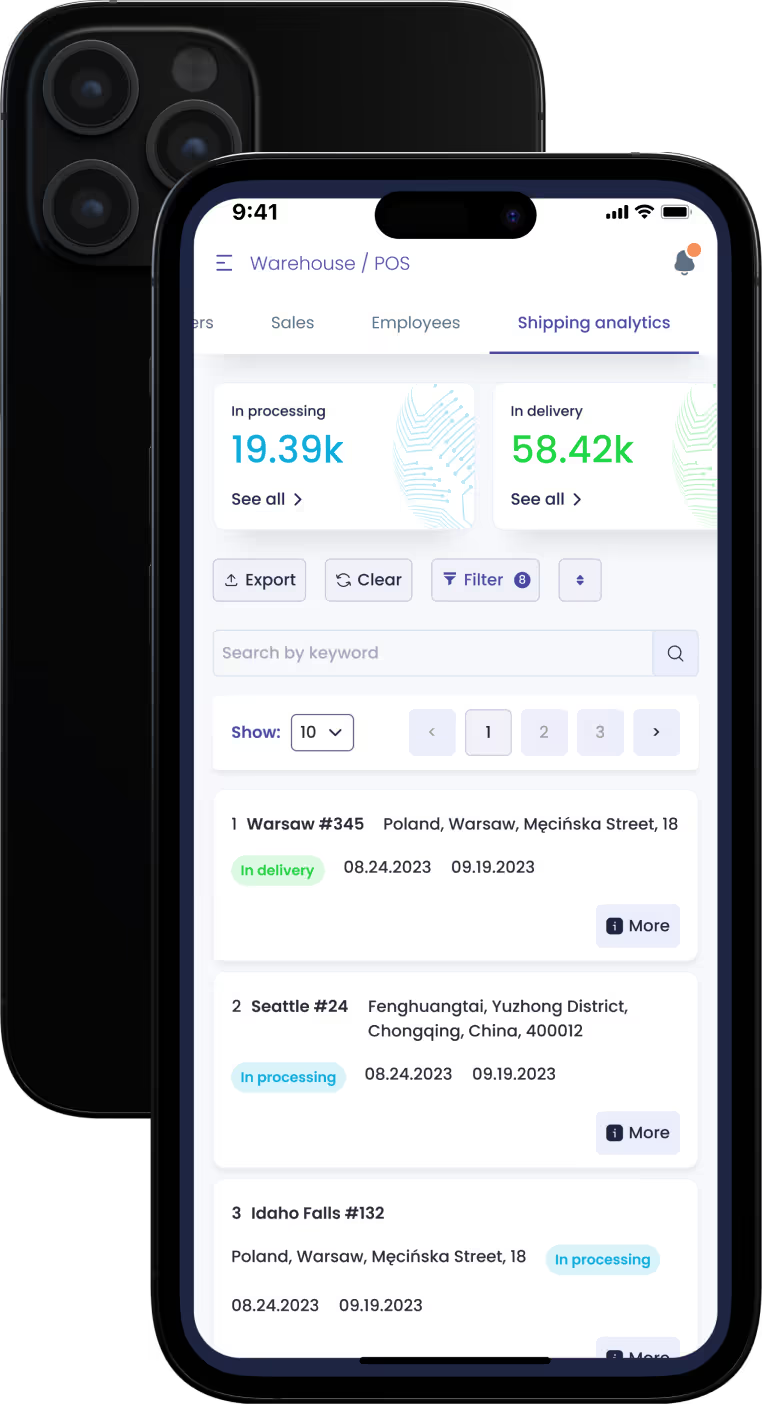
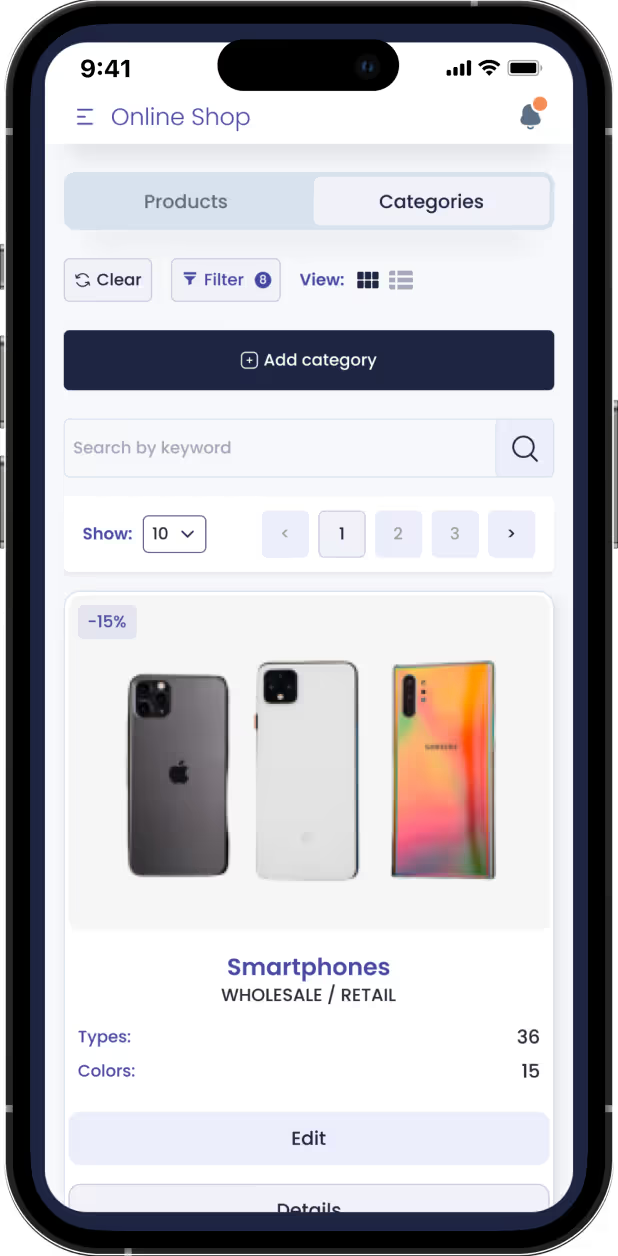
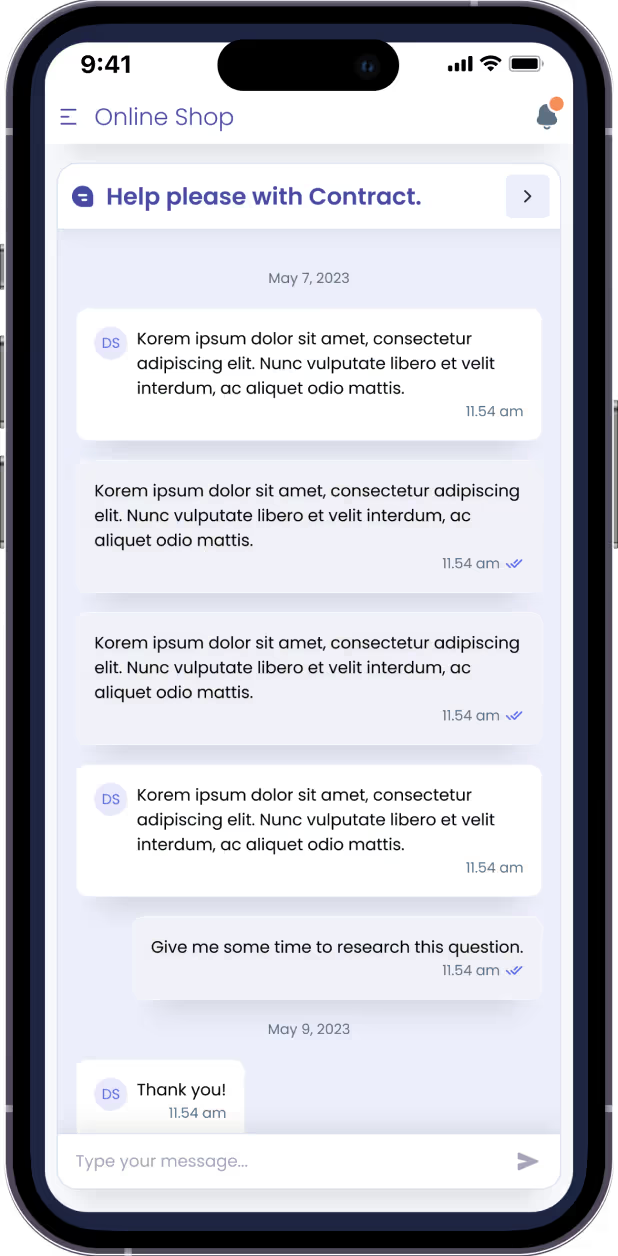
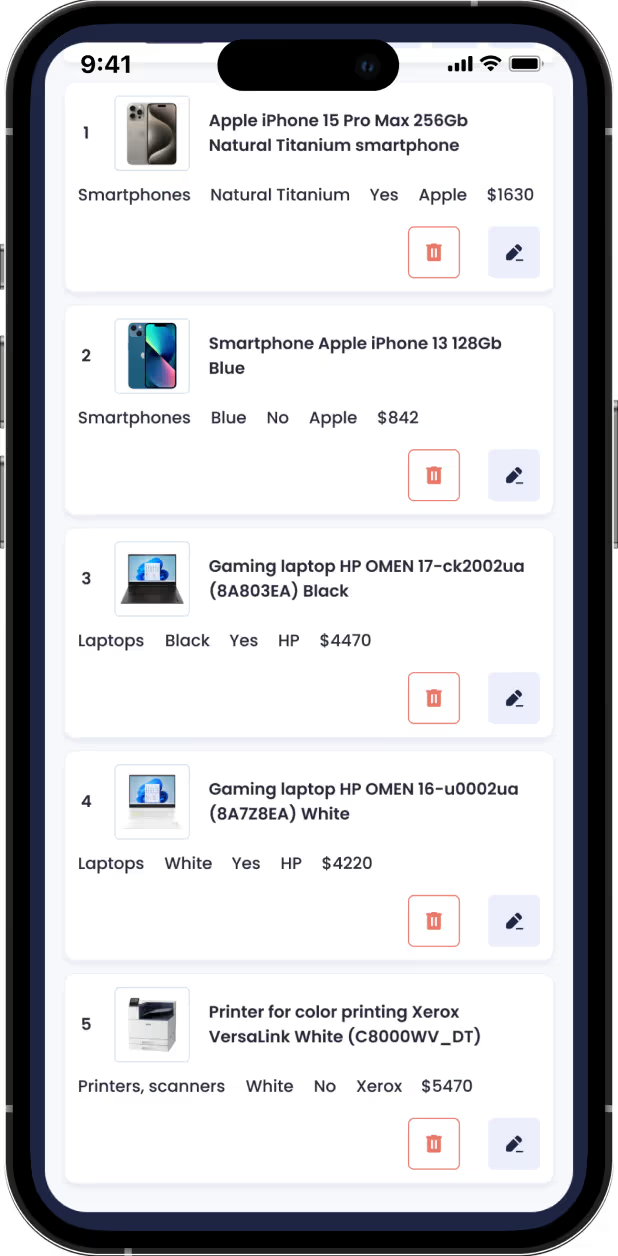
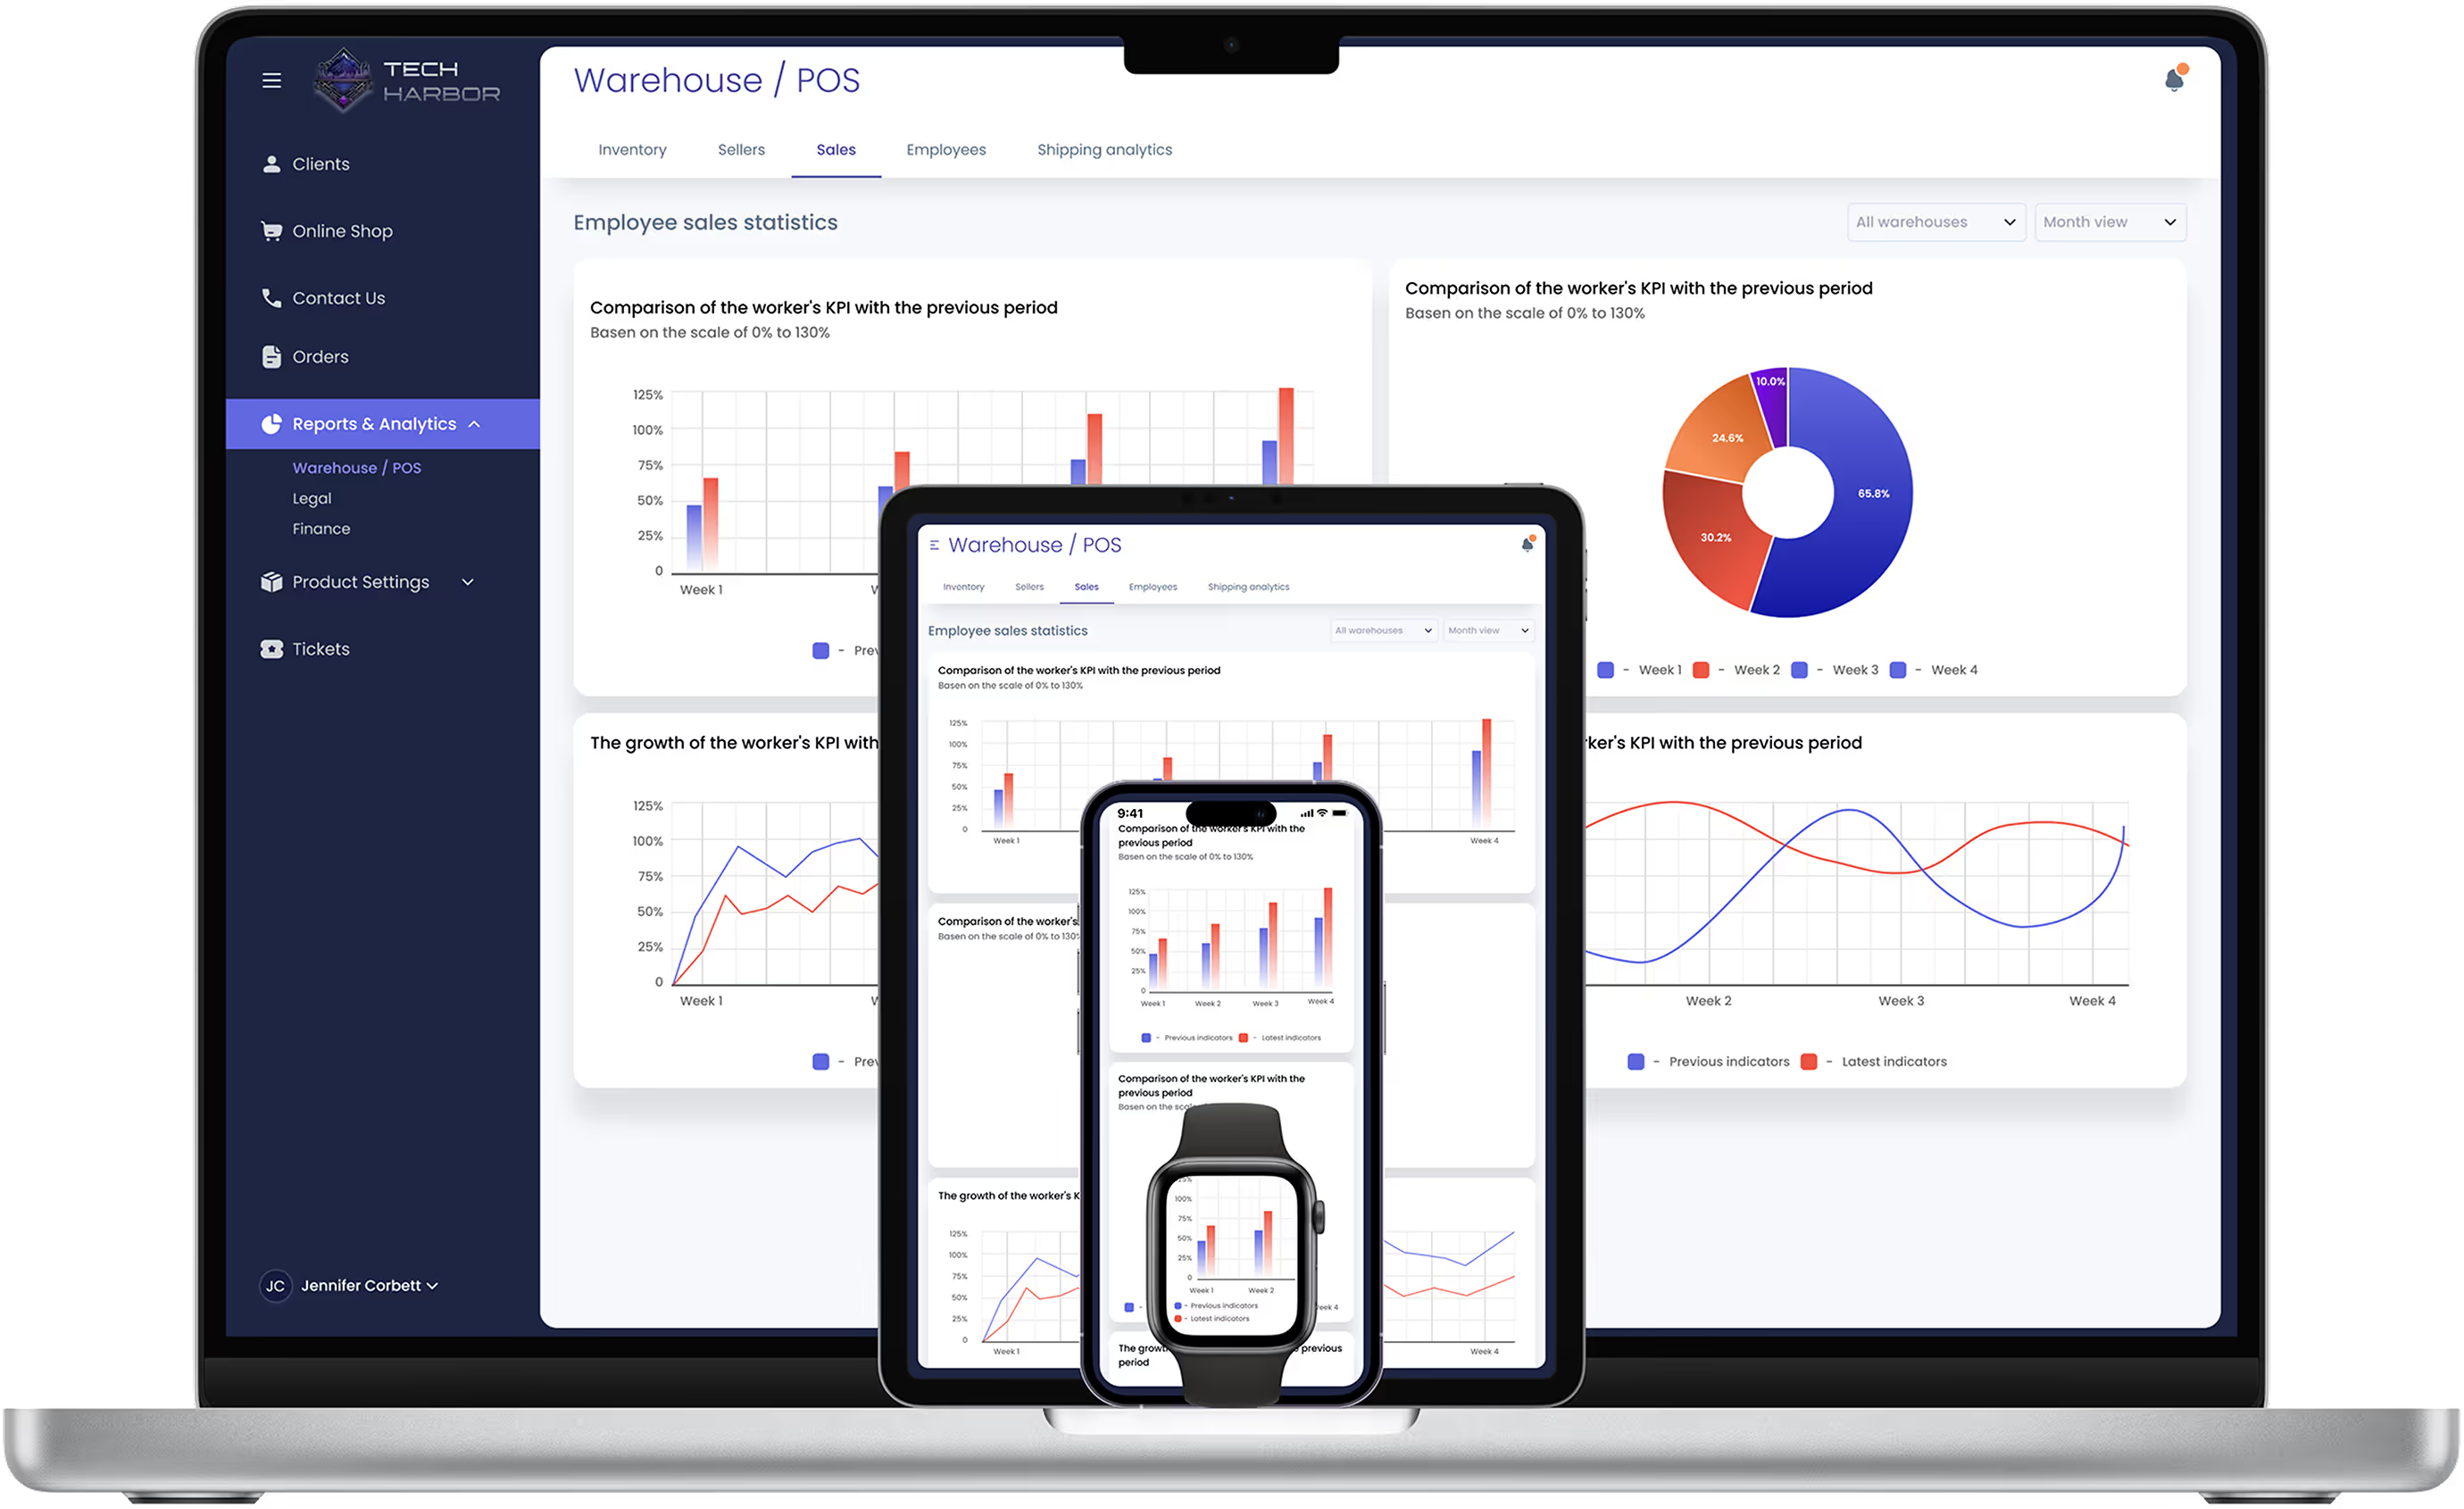
After a second usability study, I found that search fields, filters, and buttons needed to be larger on mobile devices. Spacing between input fields and buttons was also increased for better accuracy.
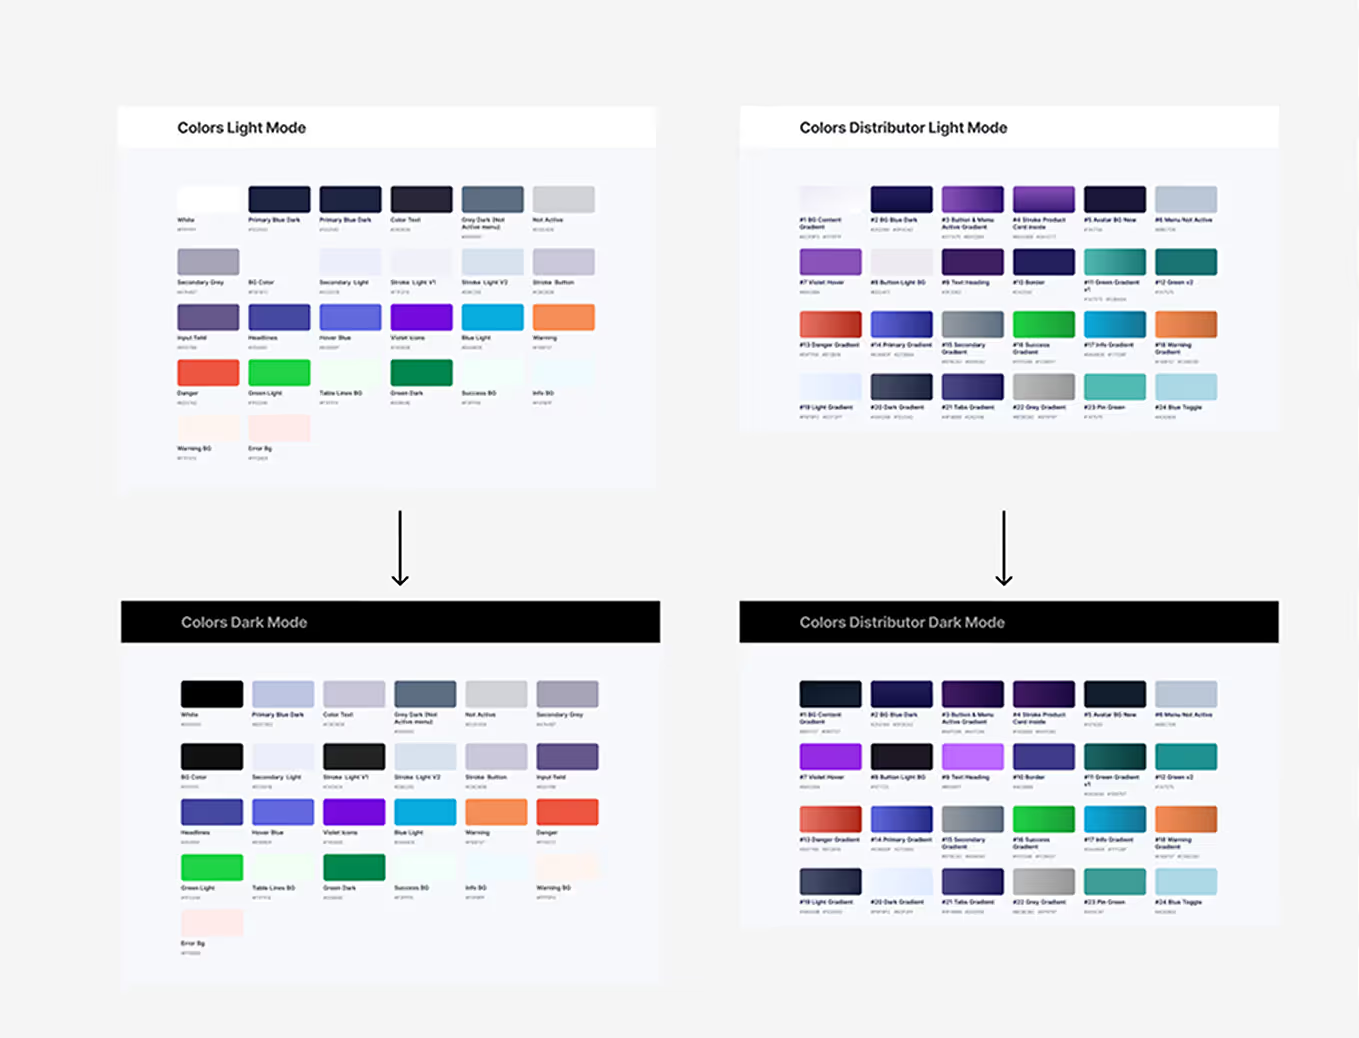
I followed responsive design principles and slightly reduced font sizes in some elements. A dark theme was added to reduce eye strain and improve comfort for users who prefer it.
Responsive Design
What I'd Measure Next
To validate the design after launch, these are the metrics and methods I would use to measure and improve the user experience:
User Behavior Tracking
Using tools like Google Analytics, Hotjar, or Mixpanel to analyze user interactions within the ERP/CRM system, identifying common friction points and areas for improvement.
Conversion & Engagement Metrics
Measuring how efficiently users navigate between features, complete tasks (e.g., adding clients, generating reports), and engage with automated workflows.
⏱️
Task Completion & Time Efficiency
Tracking how long it takes users to complete key actions in the system, aiming to reduce time spent on repetitive processes.
Heatmaps & Session Recordings
Identifying usability pain points by visualizing clicks, scroll depth, and interaction patterns with features such as the client management table.
A/B Testing for UI Improvements
Testing different layouts, button placements, and form designs to improve usability and adoption rates.
Accessibility Considerations
01
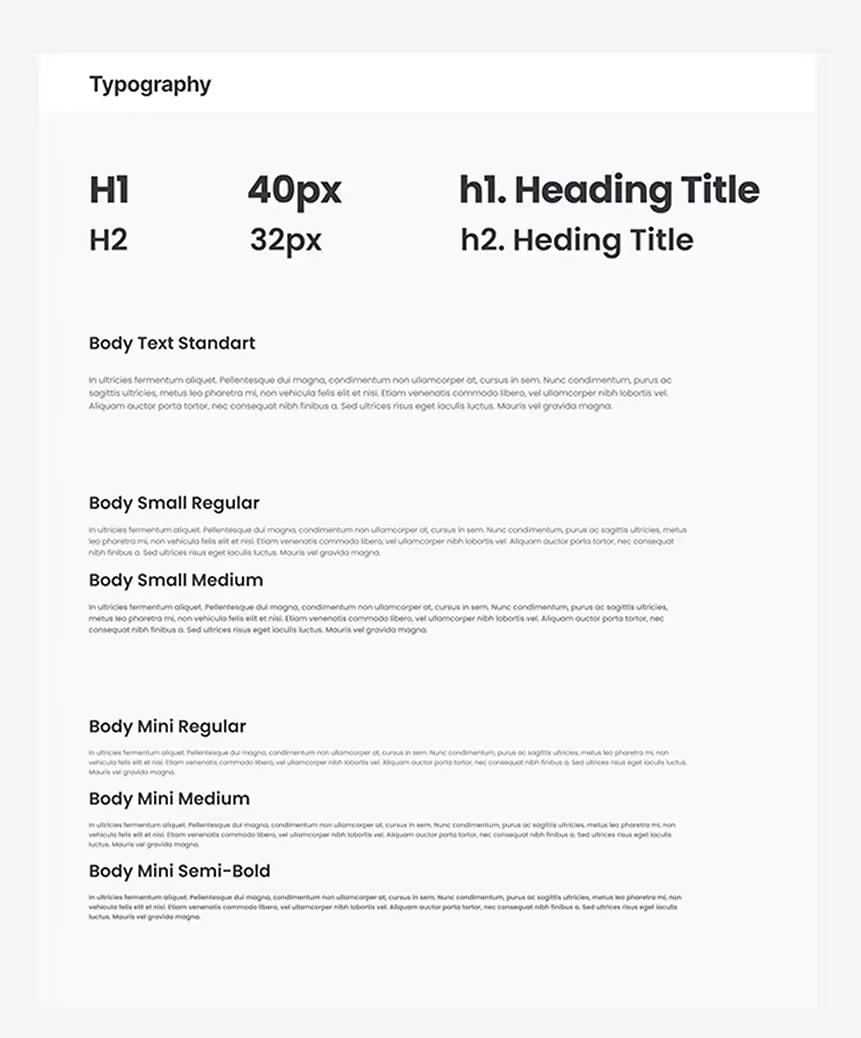
I also used a sans-serif font family “Poppins” - for easy reading of texts in the application.

02
I used colors and contrast for input fields and buttons to make them clear for people with low vision. In the coded library, component docs include states, focus styles and ARIA notes; the Storybook a11y addon is enabled.
03
I created a dark theme design for convenient use of the ERP System by various users.
Design System
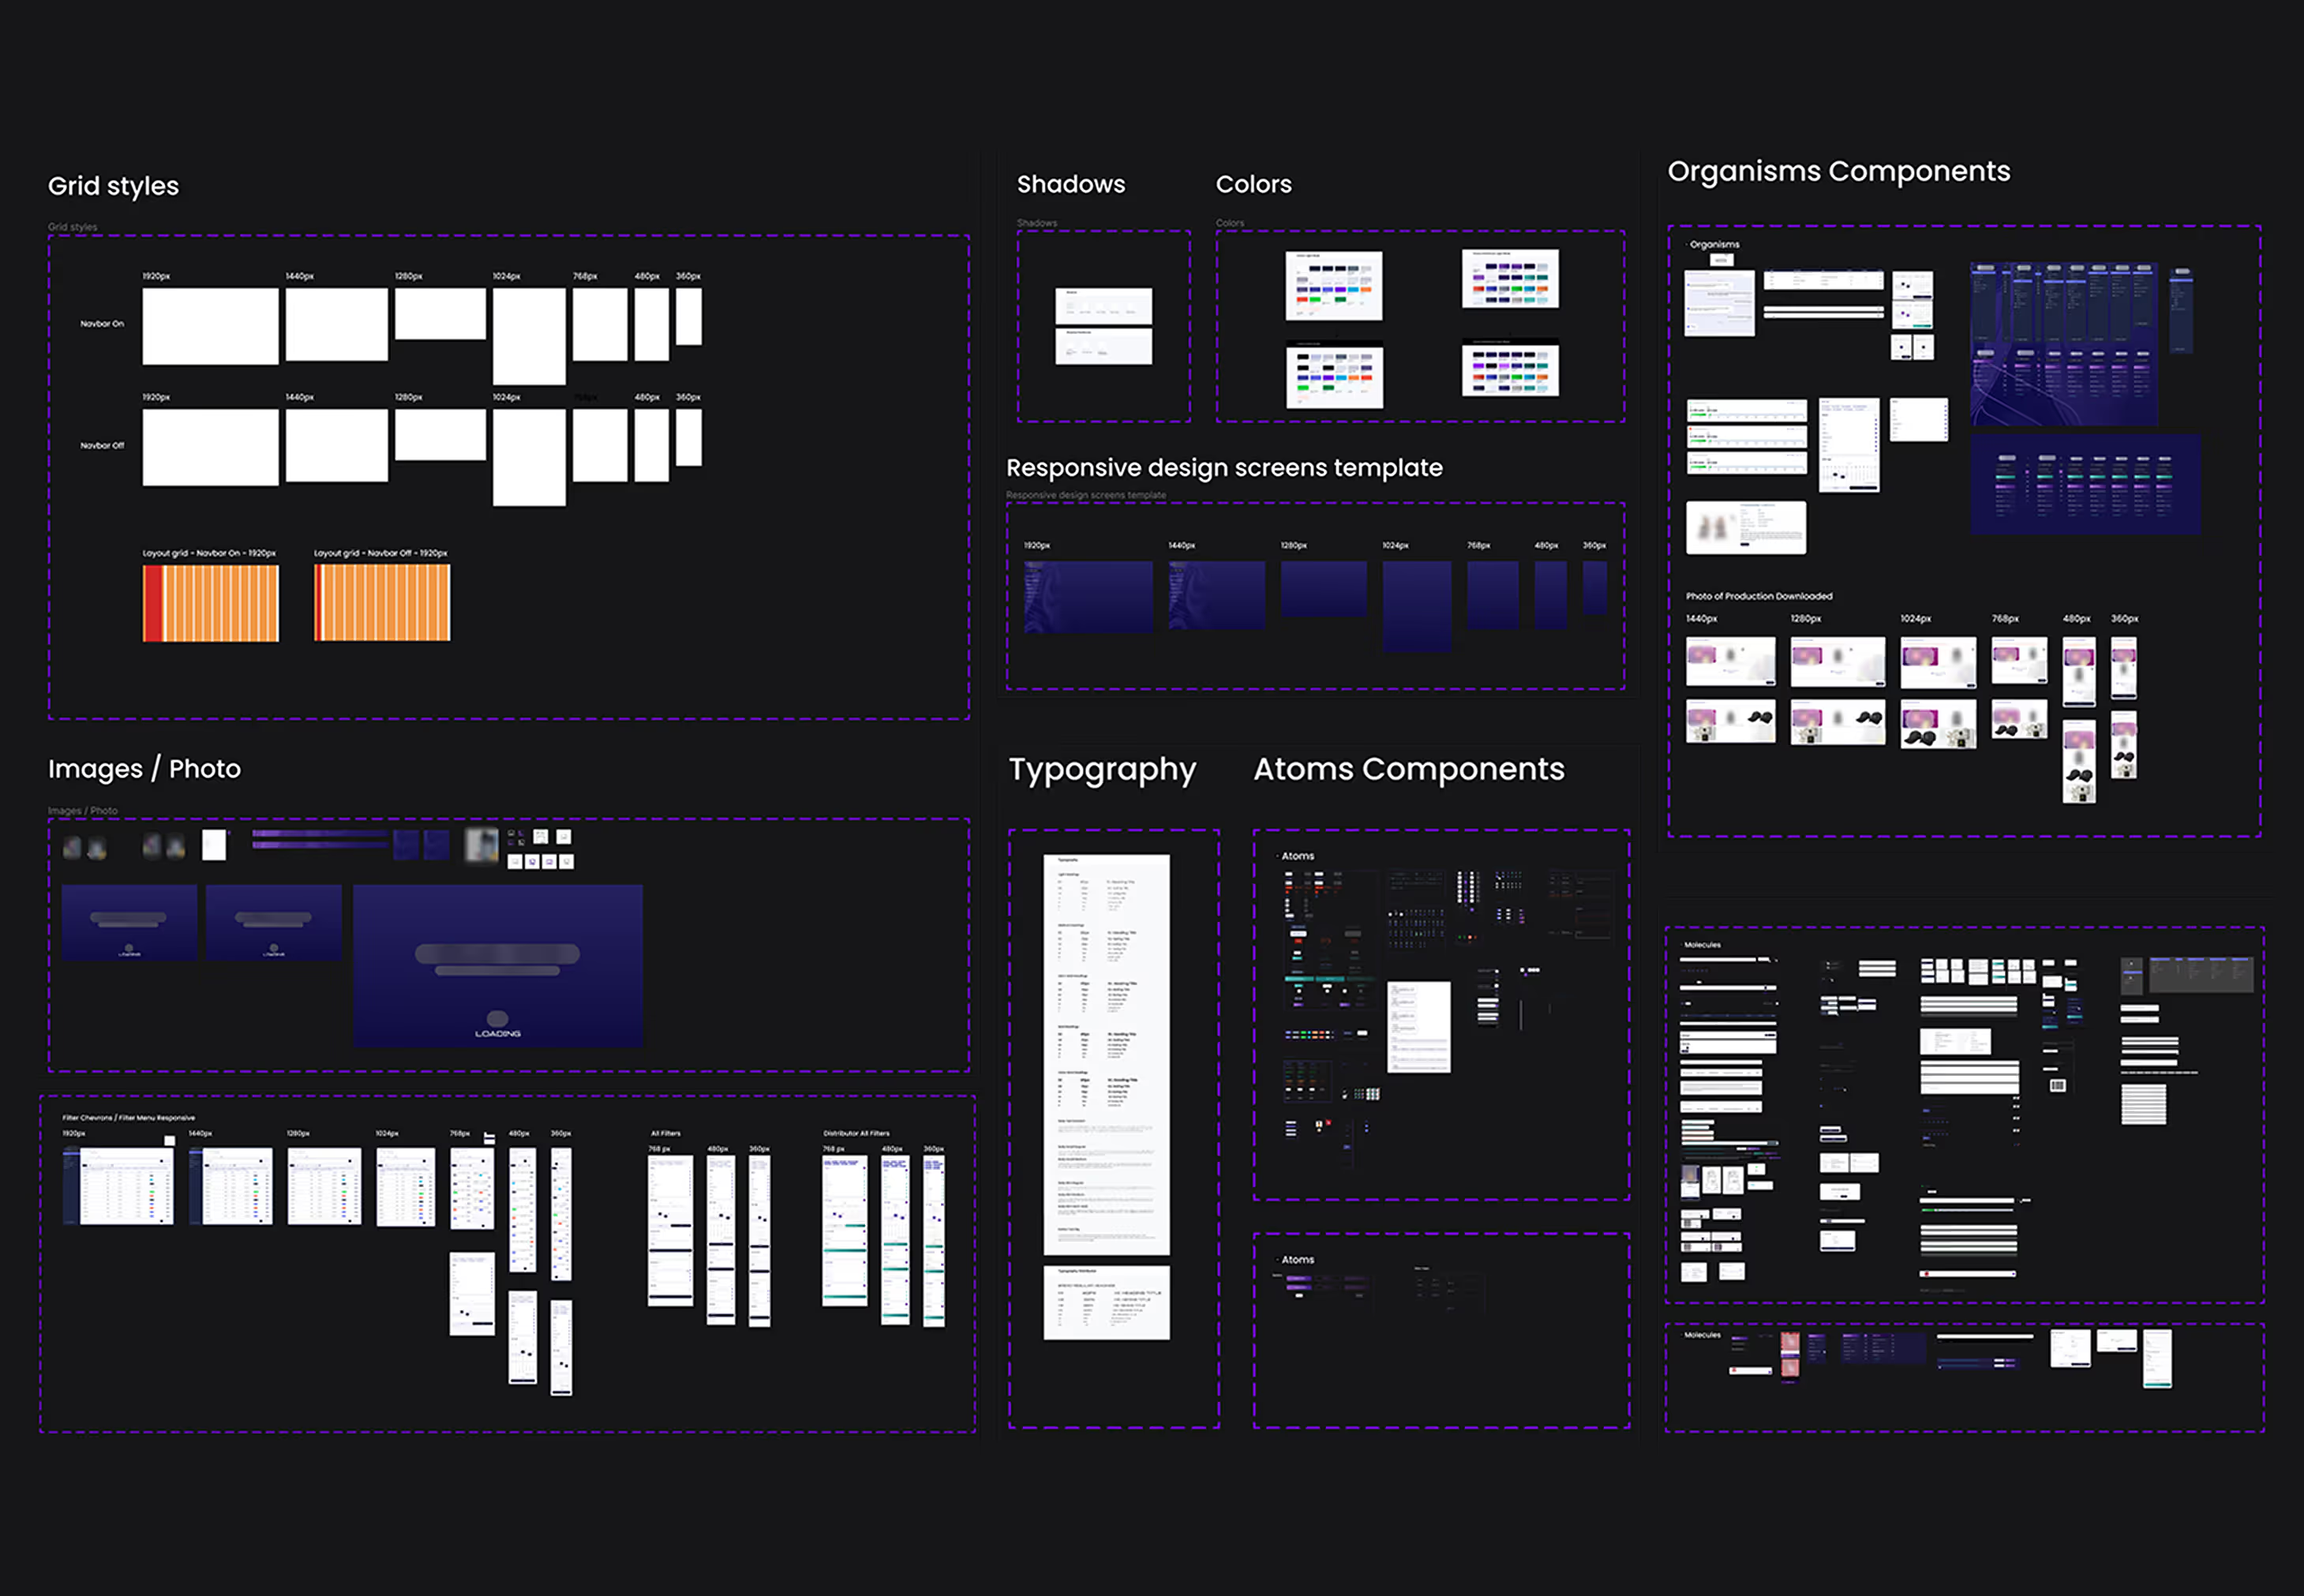
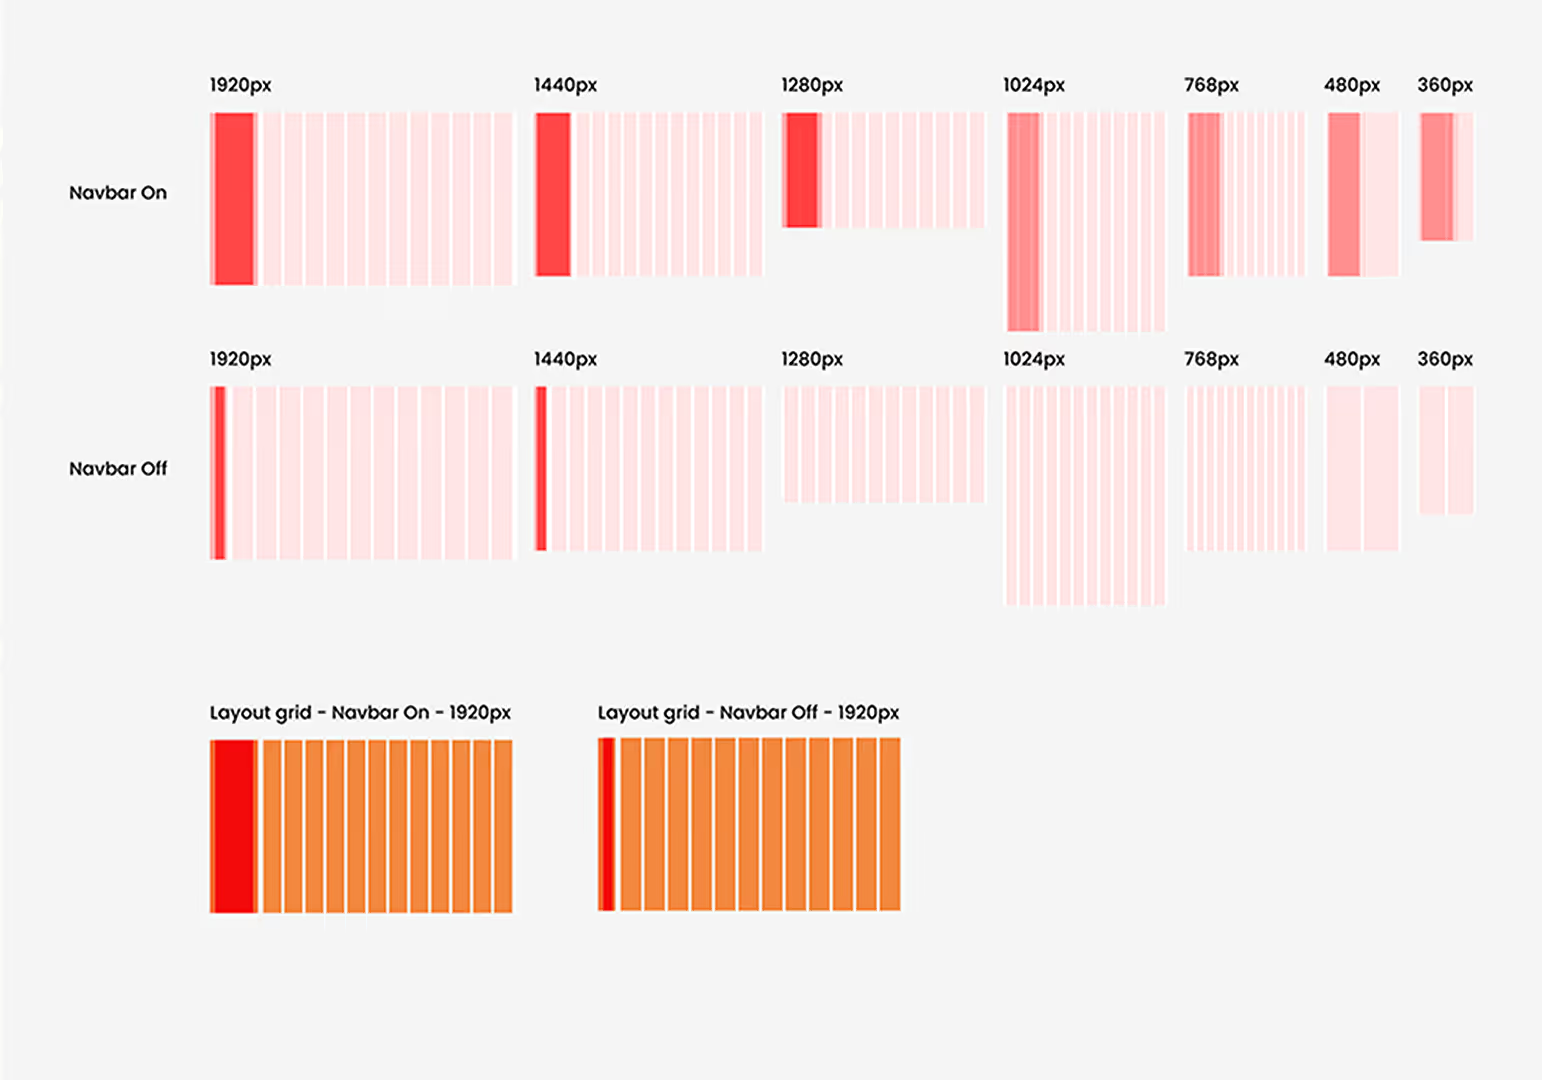
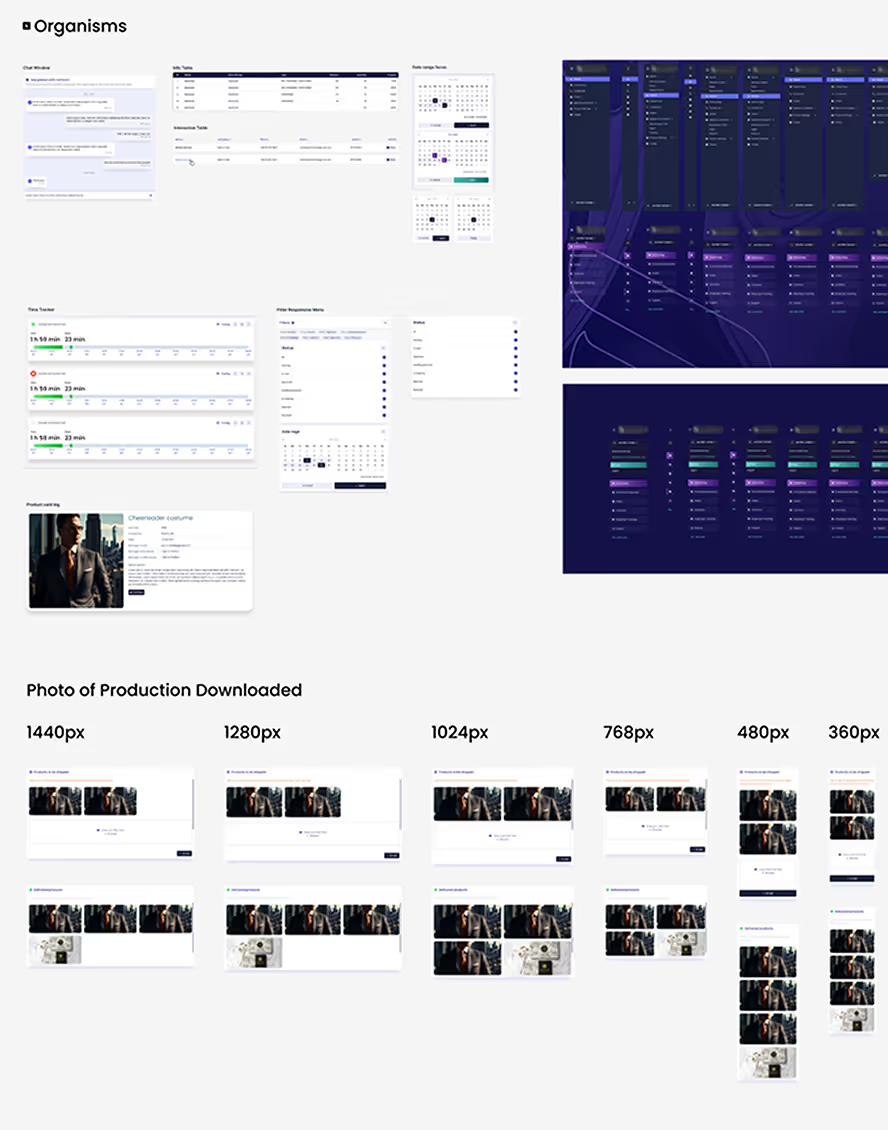
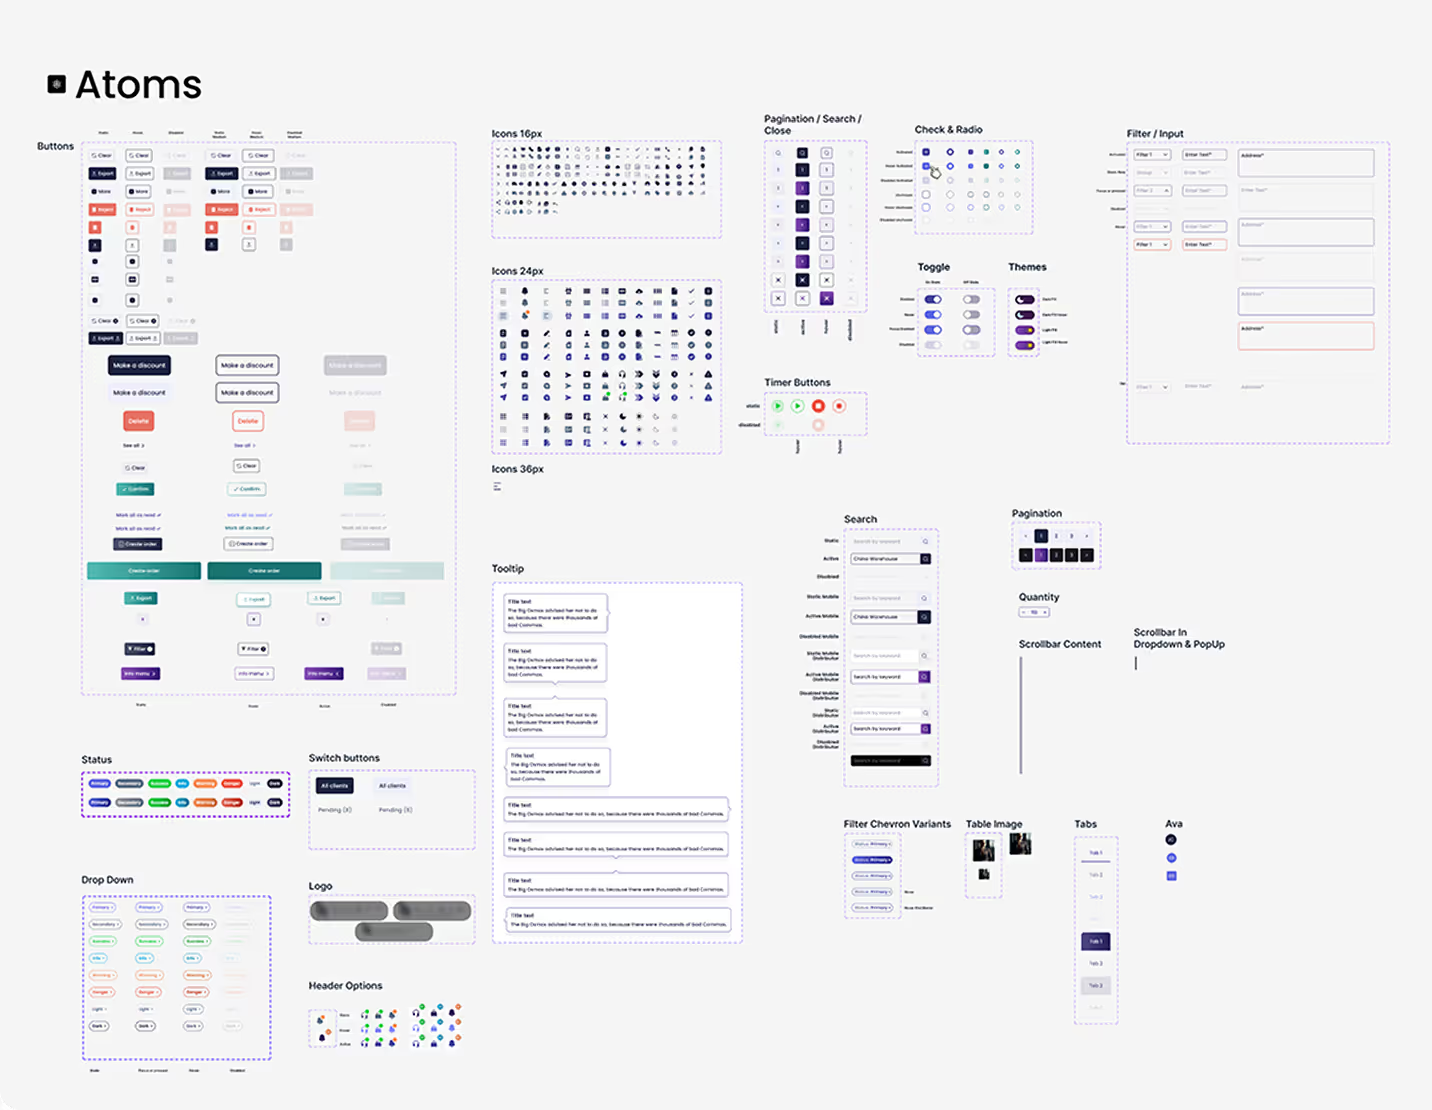
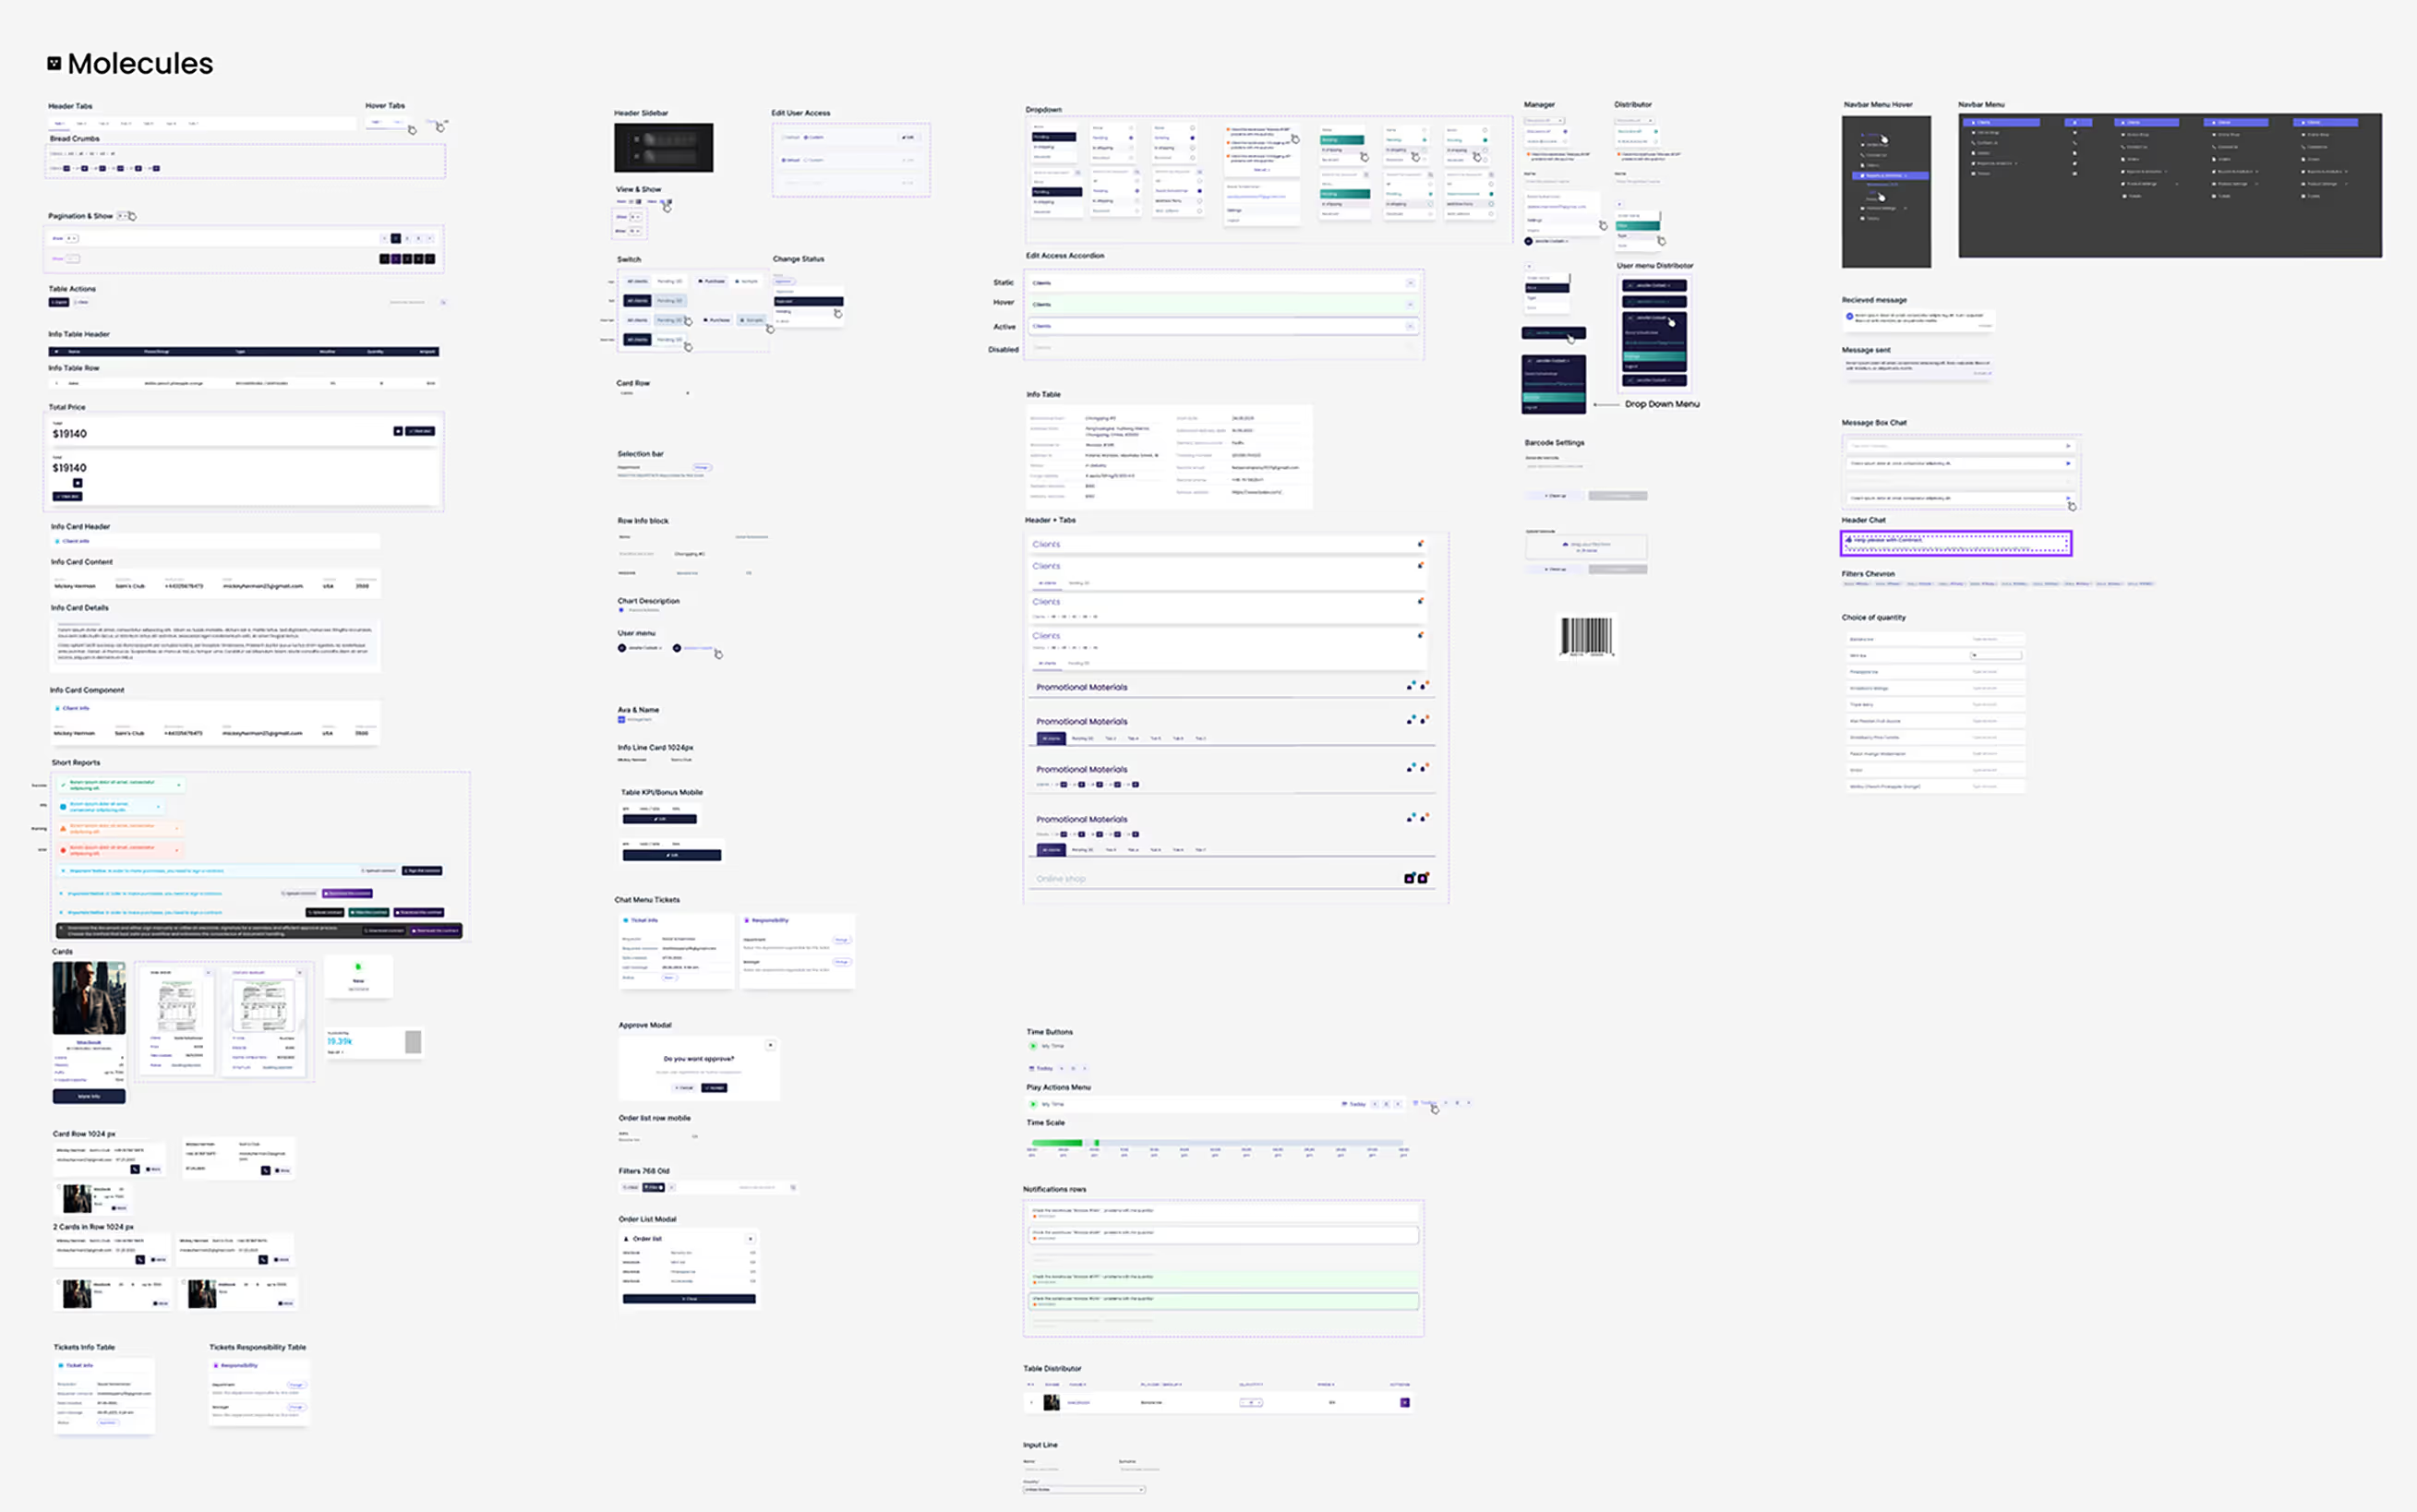
During the project I built a Design System for the ERP: shared styles, components and variants that grew together with the product as new modules and screens were added.
From Figma to Storybook
In a follow-up project (Oct 2026), I turned the ERP mockups into a coded component library: 60 React and TypeScript components (22 atoms, 38 molecules) with 242 design tokens generated from a single tokens.json. Every component is documented in Storybook with its states, edge cases, accessibility notes and a Figma-to-code mapping. I set up an AI-assisted pipeline (Figma → Figma MCP → Claude Code → GitHub pull request → Vercel preview). I chose what to build, reviewed every change and merged every pull request.
What I'd Do Next
User-Centric Testing and Documentation
Run task-based usability tests on key flows and document every issue together with its fix in the design system.
User Interviews for System Enhancement
Hold qualitative interviews with each role to find the remaining pain points and prioritise improvements.
Inclusive Usability Research for Accessibility
Run an accessibility audit against WCAG and research sessions with users with disabilities.
Impact
Users responded positively after the first month of using the ERP System, which helps automate most business processes. Here is one quote from a user:
Delivery (design system follow-up, Oct 2026)
• 60 components (22 atoms, 38 molecules)
• 242 design tokens (colors, typography, shadows, sizes, spacing, grid, layout, radii)
• 137 SVG icons in two sizes
• ~480 Storybook stories with MDX documentation
• 9 pull requests, 5 days of active work (1–5 Oct 2026)
What I Learned
When I created the first version of the ERP System, I learned to use empathy and set aside my own assumptions. Usability research helped improve the functionality and the way people work with the system. Later, turning the mockups into code taught me that design systems only scale when tokens and documentation live in code, not only in Figma.
In Summation
Elevating the ERP system's performance involves a holistic strategy encompassing comprehensive testing, user-centric enhancements, and a commitment to accessibility. By prioritizing user feedback and inclusivity, we're not just optimizing the system; we're cultivating an environment where every user's needs are met.
Link to the website of the company for which ERP System was developed: rifbar.com.